 Quality Tools and Techniques (Fishbone Diagram, Pareto Chart, Process Map)
Definition/Introduction
In a dynamic and complex healthcare system, recognizing the role of quality in patient health outcomes and resource utilization is crucial. Various factors contribute to the gap between the ideal and existing states of healthcare delivery, including a lack of awareness of needs, resistance to new methods, and workforce shortages.
The establishment of the Joint Commission in 1951, Dr. Avedis Donabedian's structure-process-outcome framework for evaluating healthcare quality in 1966, the formation of the Agency for Healthcare Research and Quality (AHRQ) in 1989 and the Institute for Healthcare Improvement in 1991 are some of the historical milestones in the evolution of quality in healthcare.[1] The Institute of Medicine (IOM) reports, the To Err Is Human in 2000 and the Crossing the Quality Chasm in 2001, have paved the way for establishing a culture of patient safety and healthcare quality.[2] The IOM advocated for a redesign of the healthcare system to promote quality and safety by supporting front-line teams in identifying practices that hinder quality care and encouraging collective exploration to build a more robust healthcare system.[2]
The IOM defines quality as the measure of service offered to individuals and communities to achieve positive health outcomes[3]. Health care aims to deliver safe, timely, effective, efficient, equitable, and patient-centered (STEP) care supported by evidence-based medicine.[4] A multidisciplinary team approach to quality improvement (QI) involves healthcare professionals, patients, and families, with each member playing a vital role in driving system-wide improvements and fostering organizational learning to improve health outcomes.[5]
QI in healthcare involves a wide range of tools and strategies. Common QI methodologies include the Model for Improvement, Plan-Do-Study-Act, Lean, and Six Sigma.[6] These methodologies employ diverse QI tools to identify root causes, address process issues, prioritize change opportunities, and anticipate potential barriers (AHRQ. QI Toolkit).
This article focuses on 3 tools used in QI—the Fishbone or Ishikawa Diagram, Pareto chart, and process mapping. These tools enable healthcare teams to identify and prioritize the root causes of the problem and decide on which aspects need to be acted on first.
Fishbone Diagram
The fishbone, also known as the cause-and-effect diagram, was introduced by Kaoru Ishikawa, who is often regarded as the father of Japanese quality for his contributions to quality management techniques [7]. This diagram is used in QI to visualize a root cause analysis (RCA) of a problem and ideate on potential actionable changes. In the diagram, the head of the fish, typically on the right side, represents the problem that occurred or the area needing improvement. Each branch, also called the bone of the diagram, corresponds to a major category of causes related to the effect (CEC. Quality Improvement tools). The teams brainstorm major causes and sub-causes by asking why the problem happened. These major causes can be categorized under the following (modifiable) headings—methods or systems, machine or equipment, manpower or people, materials, environment, and measurement (see Image. Fishbone Diagram).
The methods or systems category can include gaps in processes, training, or guidelines that lead to variability. The people or manpower category can relate to issues with human resources, cognitive errors, knowledge gaps, or biases, such as authority bias, for example, following orders simply because they were given by a doctor. Depending on the specific type of effect being analyzed in the RCA, heuristic errors can be categorized under a separate bone. The environment category focuses on what was happening at the time of the error or surrounding factors that may have facilitated its occurrence.
Thus, the fishbone diagram enables the stakeholders to identify major and minor contributors to a problem. From this comprehensive list, teams can develop successful process improvement initiatives and potential solutions through effective collaboration.
Pareto Chart
Vilfredo Pareto originally introduced the Pareto principle based on his idea that 80% of the land was only owned by 20% of the Italian population (CEC. Quality Improvement Tools). In health care, teams can apply the Pareto principle to identify the "vital few" factors that can most efficiently improve the quality of care. After root causes have been identified and causes of the issue have been quantified, factors whose cumulative contributions constitute approximately 80% of the causes of issues are considered the lowest-hanging fruits or the biggest bang for the buck. Factors that have relatively minor effects are considered the "trivial many" and constitute the remaining 20% of the causes (CEC. Quality Improvement Tools). The most frequently used visual representation of the 80/20 rule is a Pareto chart[3].
The Pareto chart consists of 2 components—a bar chart of the quantified causes ordered from most to least frequent and a line graph representing the cumulative percentage of contributions from different factors. To create a Pareto chart, first identify causes and then quantify the number of errors attributable to each cause. Pareto charts can be created in Excel using a table of causes and frequencies. The Pareto chart feature is categorized under Histogram Charts when inserting a chart.
The example Pareto chart (see Image. Pareto Chart) lists patient falls on a specific medical unit identified as the problem. The X-axis of the chart depicts the major categories of causes contributing to the problem. To determine which fall prevention strategies most efficiently promote patient safety, the bar graph is ordered left to right from most (vital few) to least (trivial many) frequent. The next step is to calculate the cumulative percentage curve or line graph, which is depicted by connecting the dots at the first, second, and third contribute percentages, and so on. The line graph is overlaid on the bar chart, with its axis on the right side of the graph. The 80/20 rule is applied by identifying the point where the cumulative percentage line graph intersects with 80% on the percentage axis. Factors that fall to the left of this point are the vital few or most impactful causes, whereas the factors to the right of the intersection are the trivial many. Working on the most frequent contributors to failure significantly impacts the given problem.[3] The 80/20 rule helps optimize where QI efforts and resources are most efficiently expended, especially when garnering support for QI projects and allotting resources.
Process Map
Process mapping was introduced by Frank Gilbreth in the early 1900s (NIH. Process Mapping). Unlike written standard operating procedures that outline the ideal process, process maps provide a detailed, step-by-step depiction of the actual procedures, revealing potential duplications, delays, decision points, variations, and inefficiencies (NIH. Process Mapping). Process mapping in health care typically requires the perspectives of diverse stakeholders to identify different levels of interwoven and complex processes [8]. Other terms associated with process mapping include spaghetti diagrams (process maps with curved arrows instead of straight ones) and swim lanes (for complex processes with multiple parallel activities, such as discharge planning).
The process mapping begins by:
- Determining the scope by identifying clear start and endpoints of workflow
- Identifying and engaging stakeholders
- Mapping the process workflow as a team.
Formats are flexible and may include sticky notes, whiteboards, and electronic software, such as MS Visio, Smart Draw, and PowerPoint. Shapes in the process map can be used to visually differentiate process types. The shapes represent start and end points, actions performed, delays, and decision points. Shapes may vary, and legends should be provided to the team. These shapes are connected by arrows to depict the direction of the process flow.[9]
In the example process map, a simplified flowchart illustrates the process of documenting medication reconciliations for patients admitted to hospital medicine through the emergency department (see Image. Process Map). Steps in the process should be arranged in the correct order. Stakeholders, especially those on the front line, can help to determine accuracy and highlight any variations in the process. The draft process map should then be validated during a Gemba walk, which involves directly observing the actual workflow. Discrepancies and variations found can be corrected on the map.
The finalized current state process map can be used to develop targeted QI plans. Process mapping also plays a crucial role in RCA. A future state plan can be discussed with stakeholders and redrawn to optimize team workflow during the QI project design.[9]
Issues of Concern
Register For Free And Read The Full Article
 Search engine and full access to all medical articles
- 10 free questions in your specialty
- Free CME/CE Activities
- Free daily question in your email
- Save favorite articles to your dashboard
- Emails offering discounts
Learn more about a Subscription to StatPearls Point-of-Care
Issues of Concern
The effective use of QI principles by healthcare professionals is essential to achieve safe, evidence-based, patient-centered care. To implement successful QI programs, strong leadership across the organization is required to support frontline staff and offer training in QI methodologies to promote cultures of continuous learning.[5] Some common challenges for QI project implementation include resistance to change, lack of training in QI methodologies, time constraints, low motivation, competing priorities, lack of teamwork or stakeholder engagement, ineffective leadership, and organizational support.[10]
Complexity management and human factor training resources are key factors for team engagement.[11] Various QI methods and tools exist. Choosing the right methods and tools for each QI project can accelerate goal achievement. Fishbone diagrams, Pareto charts, and process maps are valuable tools for helping define areas of action and craft SMART (specific, measurable, achievable, relevant, time-bound) aims for project design. Whichever QI tools are used, keeping patient safety and experience top of mind while reducing waste and increasing the value of care is important.
Clinical Significance
Medical errors pose a serious threat to public health in the United States.[12] Healthcare organizations must regularly conduct QI programs and promote systems-based learning, which empowers employees to apply the principles of healthcare quality to promote patient safety.[13] The introduction of the QI curriculum in early medical education and the promotion of safety culture in organizations improves healthcare efficiency and patient outcomes.[14] John Kotter puts forth 8 principles to promote a patient safety culture: [15]
- Establishing a sense of urgency in change initiation
- Building a powerful guiding coalition for goal alignment
- Creating a vision to direct the change effort
- Communicating the vision
- Team empowerment to act on the vision
- Generating short-term wins
- Consolidating improvements to produce positive changes
- Anchor new approaches in the organization's culture.
Effective change management involves a thorough understanding of the need for change and inclusive leadership. By fostering a collaborative approach, stakeholders can develop action plans that enhance healthcare efficiency and sustainability.[16]
Nursing, Allied Health, and Interprofessional Team Interventions
The application of QI principles in health care has significantly evolved over the past century. Proficiency in RCA methodologies enables healthcare teams to improve patient care and mitigate medical errors. Please see StatPearls' companion resource, "Root Cause Analysis and Medical Error Prevention," for more information. Effective leadership establishes vision, aligns, motivates, and inspires teams to bring positive and sustainable changes.[15]
Key steps for effective organizational performance include supportive QI leadership, collaborative teamwork, staff training in QI methodologies, patient and team feedback utilization, and success celebration (AHRQ. Toolkit for Using AHRQ Quality Indicators). Strong interprofessional networking, education, administrative support, and motivation are essential for developing robust healthcare teams and patient safety champions, who are pivotal in delivering safe, evidence-based, patient-centered care.[17]
Media
(Click Image to Enlarge)
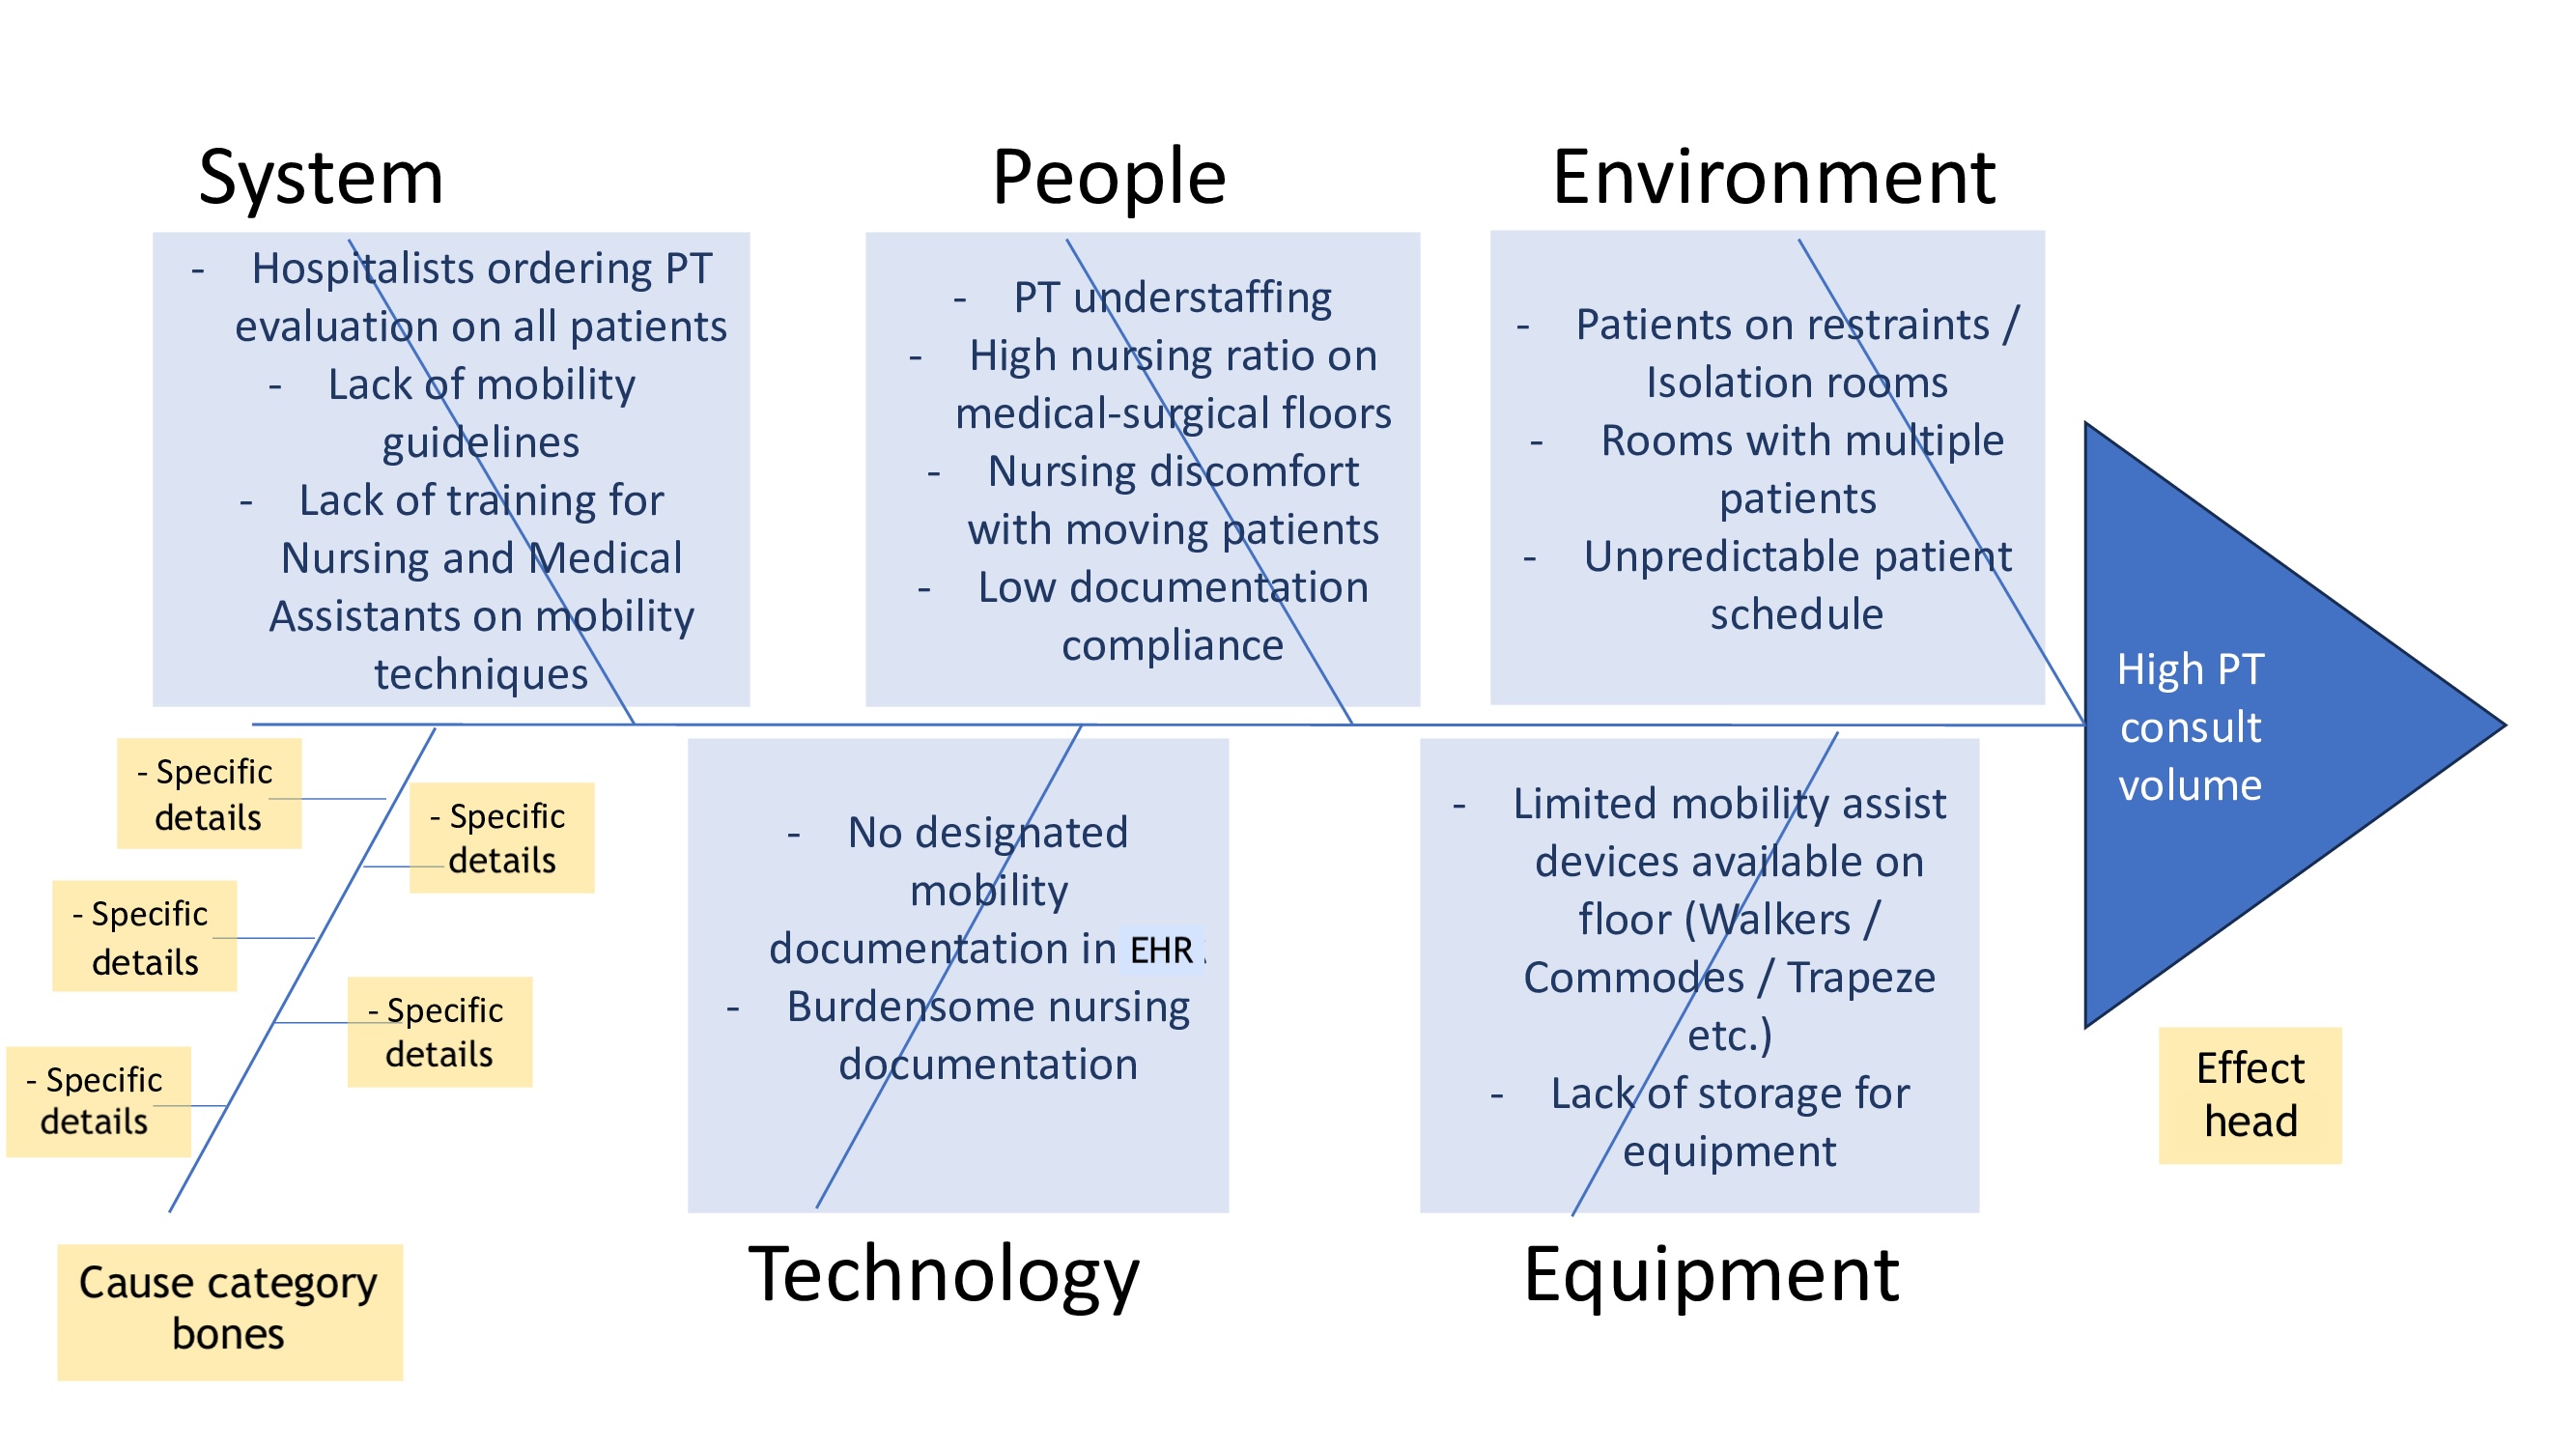
Fishbone Diagram. This fishbone diagram illustrates the root causes of problems related to high physical therapy (PT) consult volume, represented as the head of the fish. In this example, 5 cause categories or bones are identified—Systems, People, Environment, Materials, and Equipment. EHR, electronic health record.
Contributed by S Tagaram, MD
(Click Image to Enlarge)
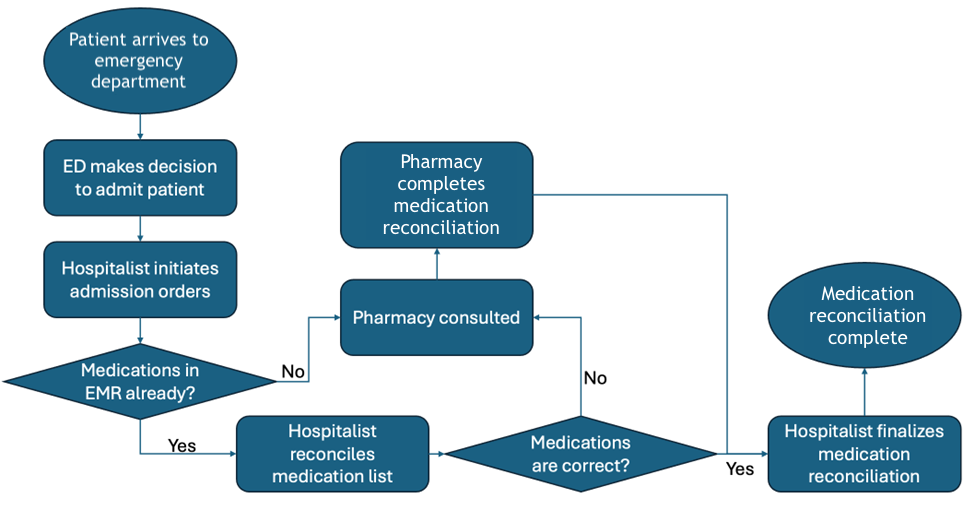
Process Map. This process map illustrates the medication reconciliation process in the emergency department (ED) for patients admitted to the hospitalist service. The ovals here represent the start and end points of the process, rectangles denote the steps involved, and the diamond shape indicates a decision point. EMR, electronic medical record.
Contributed by S Tagaram, MD
(Click Image to Enlarge)
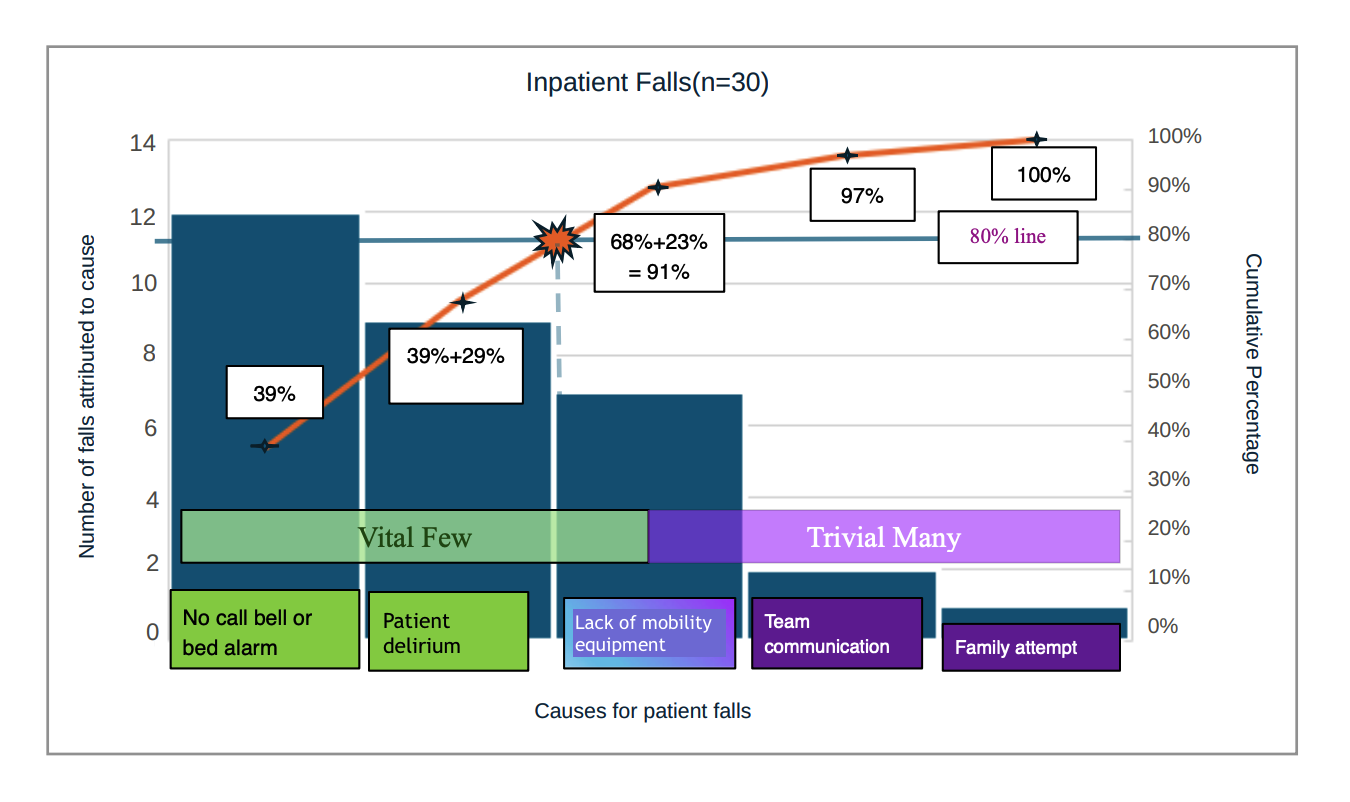
Pareto Chart. This Pareto chart for inpatient falls shows 5 causes. The left-side Y-axis displays the number of falls attributed to each cause. The right-side Y-axis shows the cumulative percentage contribution of these causes. The point where the orange line intersects with the horizontal solid blue 80% line indicates the most vital causes for the project. The vertical dotted blue line represents this transition from vital few to trivial many. In this example, the vital few could be either the first 2 or 3 causes on the left, depending on the resources allocated to the project, as the dotted line intersects the third cause (lack of mobility equipment). The 2 right-most causes (team communication and family attempt) contribute only 9% to the total. Efforts towards addressing these causes do not significantly impact the number of falls.
Contributed by S Tagaram, MD
References
Comfere NI, Matulis JC 3rd, O'Horo JC. Quality improvement and healthcare: The Mayo Clinic quality Academy experience. Journal of clinical tuberculosis and other mycobacterial diseases. 2020 Aug:20():100170. doi: 10.1016/j.jctube.2020.100170. Epub 2020 Jun 13 [PubMed PMID: 32596515]
Institute of Medicine (US) Committee on Quality of Health Care in America. Crossing the Quality Chasm: A New Health System for the 21st Century. 2001:(): [PubMed PMID: 25057539]
Level 2 (mid-level) evidenceAlkiayat M. A Practical Guide to Creating a Pareto Chart as a Quality Improvement Tool. Global journal on quality and safety in healthcare. 2021 May:4(2):83-84. doi: 10.36401/JQSH-21-X1. Epub 2021 Apr 28 [PubMed PMID: 37260788]
Level 2 (mid-level) evidenceAtkinson S, Ingham J, Cheshire M, Went S. Defining quality and quality improvement. Clinical medicine (London, England). 2010 Dec:10(6):537-9 [PubMed PMID: 21413472]
Level 2 (mid-level) evidenceAdams D. Quality improvement; part 1: introduction and overview. BJA education. 2018 Mar:18(3):89-94. doi: 10.1016/j.bjae.2017.12.002. Epub 2018 Jan 27 [PubMed PMID: 33456816]
Level 2 (mid-level) evidencePuri I, Hollingshead CM, Tadi P. Quality Improvement. StatPearls. 2024 Jan:(): [PubMed PMID: 32310557]
Level 2 (mid-level) evidenceWong KC. Using an Ishikawa diagram as a tool to assist memory and retrieval of relevant medical cases from the medical literature. Journal of medical case reports. 2011 Mar 29:5():120. doi: 10.1186/1752-1947-5-120. Epub 2011 Mar 29 [PubMed PMID: 21447163]
Level 3 (low-level) evidenceAntonacci G, Lennox L, Barlow J, Evans L, Reed J. Process mapping in healthcare: a systematic review. BMC health services research. 2021 Apr 14:21(1):342. doi: 10.1186/s12913-021-06254-1. Epub 2021 Apr 14 [PubMed PMID: 33853610]
Level 1 (high-level) evidenceHeher YK, Chen Y. Process mapping: A cornerstone of quality improvement. Cancer cytopathology. 2017 Dec:125(12):887-890. doi: 10.1002/cncy.21946. Epub 2017 Nov 22 [PubMed PMID: 29165909]
Level 2 (mid-level) evidenceMadu A. Challenges in conducting quality improvement projects: reflections of a junior doctor. Future healthcare journal. 2022 Nov:9(3):333-334. doi: 10.7861/fhj.2022-0076. Epub [PubMed PMID: 36561816]
Level 2 (mid-level) evidenceJones B, Vaux E, Olsson-Brown A. How to get started in quality improvement. BMJ (Clinical research ed.). 2019 Jan 17:364():k5408. doi: 10.1136/bmj.k5437. Epub 2019 Jan 17 [PubMed PMID: 30655245]
Level 2 (mid-level) evidenceRodziewicz TL, Houseman B, Vaqar S, Hipskind JE. Medical Error Reduction and Prevention. StatPearls. 2024 Jan:(): [PubMed PMID: 29763131]
Tossaint-Schoenmakers R, Versluis A, Chavannes N, Talboom-Kamp E, Kasteleyn M. The Challenge of Integrating eHealth Into Health Care: Systematic Literature Review of the Donabedian Model of Structure, Process, and Outcome. Journal of medical Internet research. 2021 May 10:23(5):e27180. doi: 10.2196/27180. Epub 2021 May 10 [PubMed PMID: 33970123]
Level 1 (high-level) evidencede Barros LB, Bassi LC, Caldas LP, Sarantopoulos A, Zeferino EBB, Minatogawa V, Gasparino RC. Lean Healthcare Tools for Processes Evaluation: An Integrative Review. International journal of environmental research and public health. 2021 Jul 10:18(14):. doi: 10.3390/ijerph18147389. Epub 2021 Jul 10 [PubMed PMID: 34299840]
Haas MRC, Munzer BW, Santen SA, Hopson LR, Haas NL, Overbeek D, Peterson WJ, Cranford JA, Huang RD. #DidacticsRevolution: Applying Kotter's 8-Step Change Management Model to Residency Didactics. The western journal of emergency medicine. 2019 Dec 19:21(1):65-70. doi: 10.5811/westjem.2019.11.44510. Epub 2019 Dec 19 [PubMed PMID: 31913821]
Solow M, Perry TE. Change Management and Health Care Culture. Anesthesiology clinics. 2023 Dec:41(4):693-705. doi: 10.1016/j.anclin.2023.05.001. Epub 2023 Jun 28 [PubMed PMID: 37838377]
Brugman IM, Visser A, Maaskant JM, Geerlings SE, Eskes AM. The Evaluation of an Interprofessional QI Program: A Qualitative Study. International journal of environmental research and public health. 2022 Aug 15:19(16):. doi: 10.3390/ijerph191610087. Epub 2022 Aug 15 [PubMed PMID: 36011718]
Level 2 (mid-level) evidence