Function
The Computed Tomography Physics
Computed tomography (CT), also called computer-aided tomography (CAT), is a diagnostic imaging modality that uses rotating X-ray tubes, detectors, and computers to generate three-dimensional images using a linear attenuation map created from the object when X-rays pass through it. Sir Godfrey N. Hounsfield built the first CT scanner in a British research laboratory in 1967.[12]
In September 1971, the first clinical CT machine was installed at Atkinson-Morley Hospital in London.[13] Since then, the technology, capabilities, and clinical applications have changed enormously, especially after introducing multiple-row-detector CT scanners in 1998.[14] Since then, significant advancement has been made in scanner gantry rotation speeds, temporal and spatial resolutions, detector coverage, and overall scan times.[15]
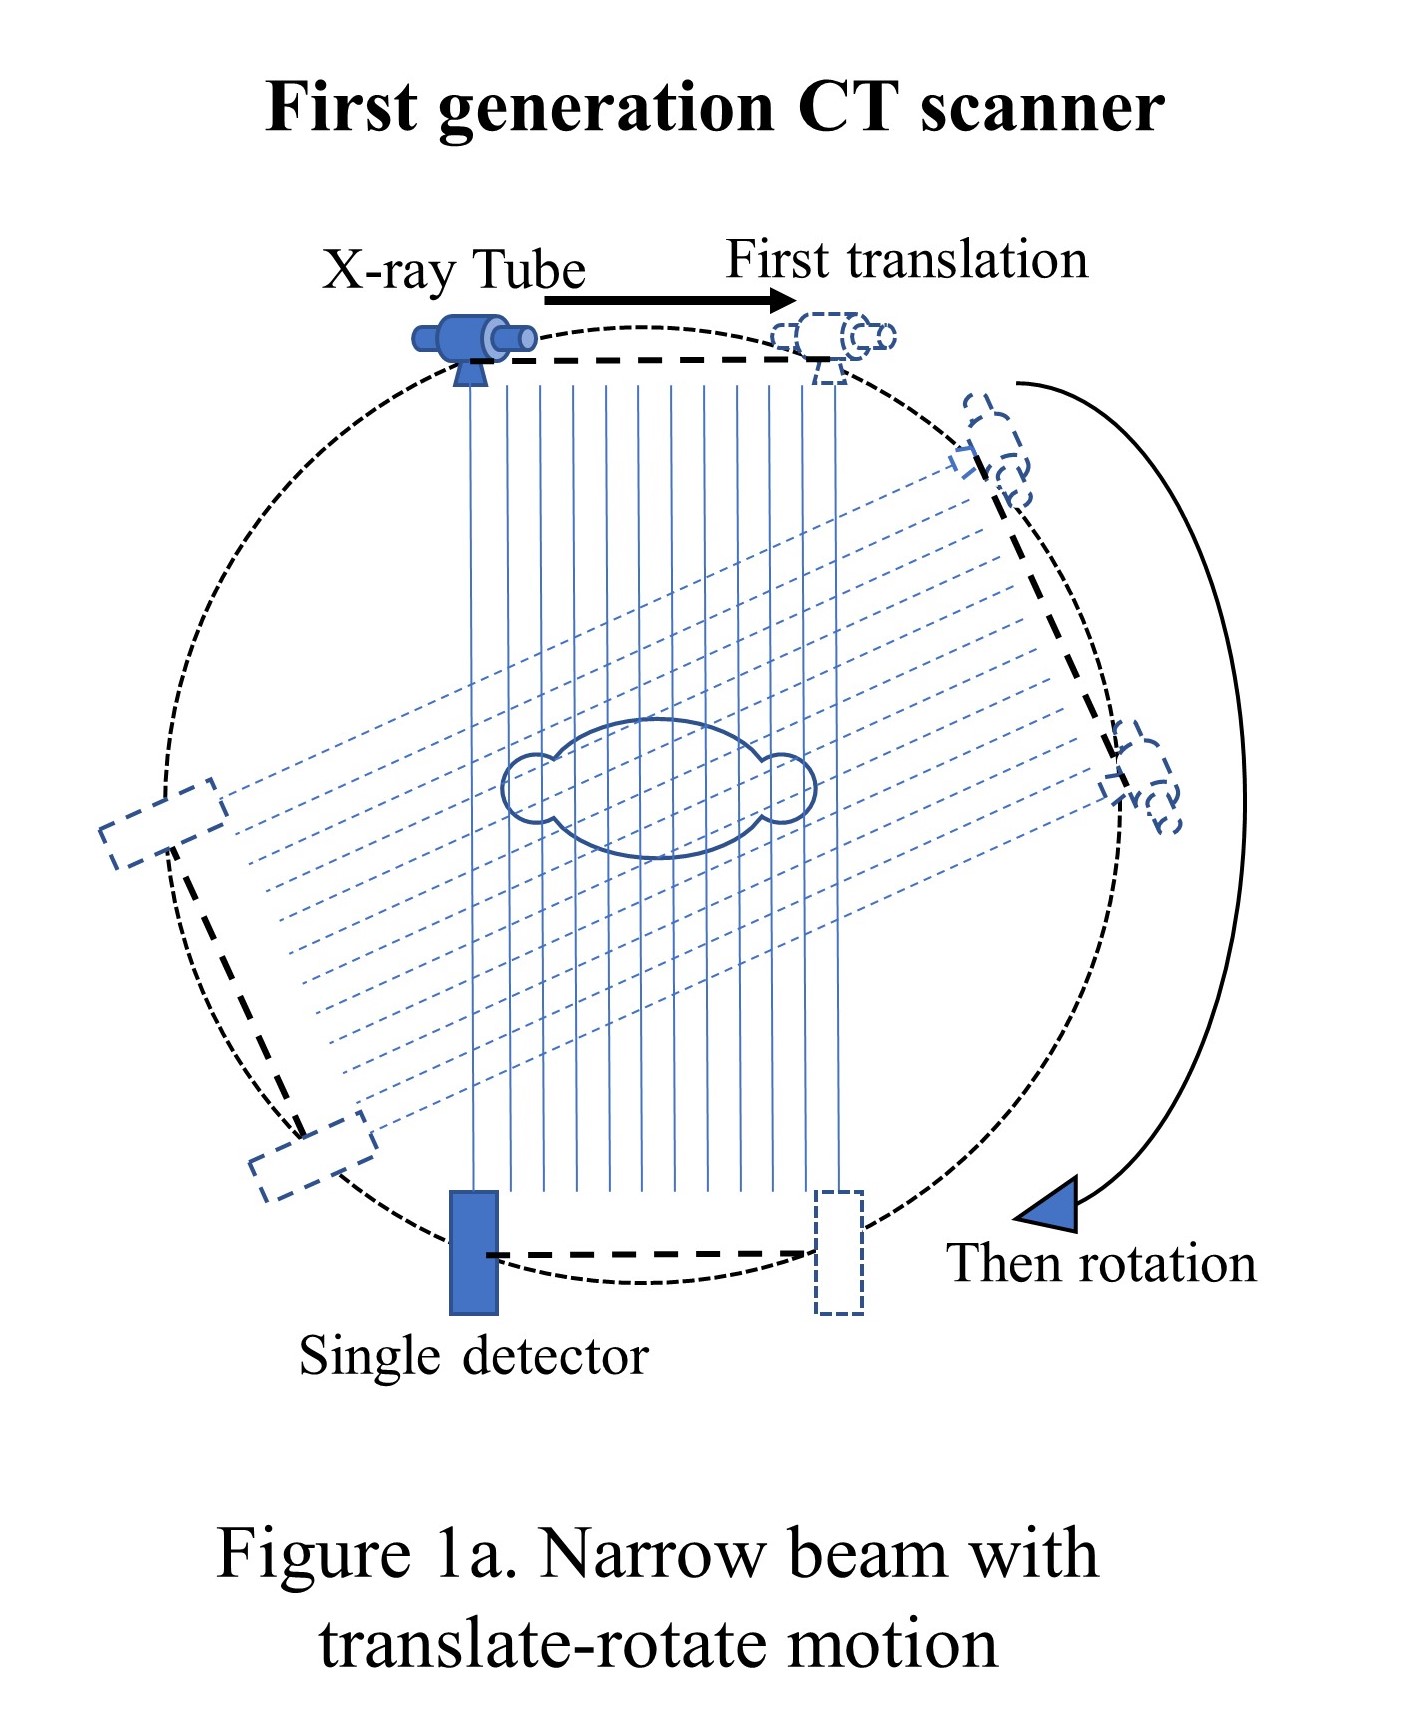
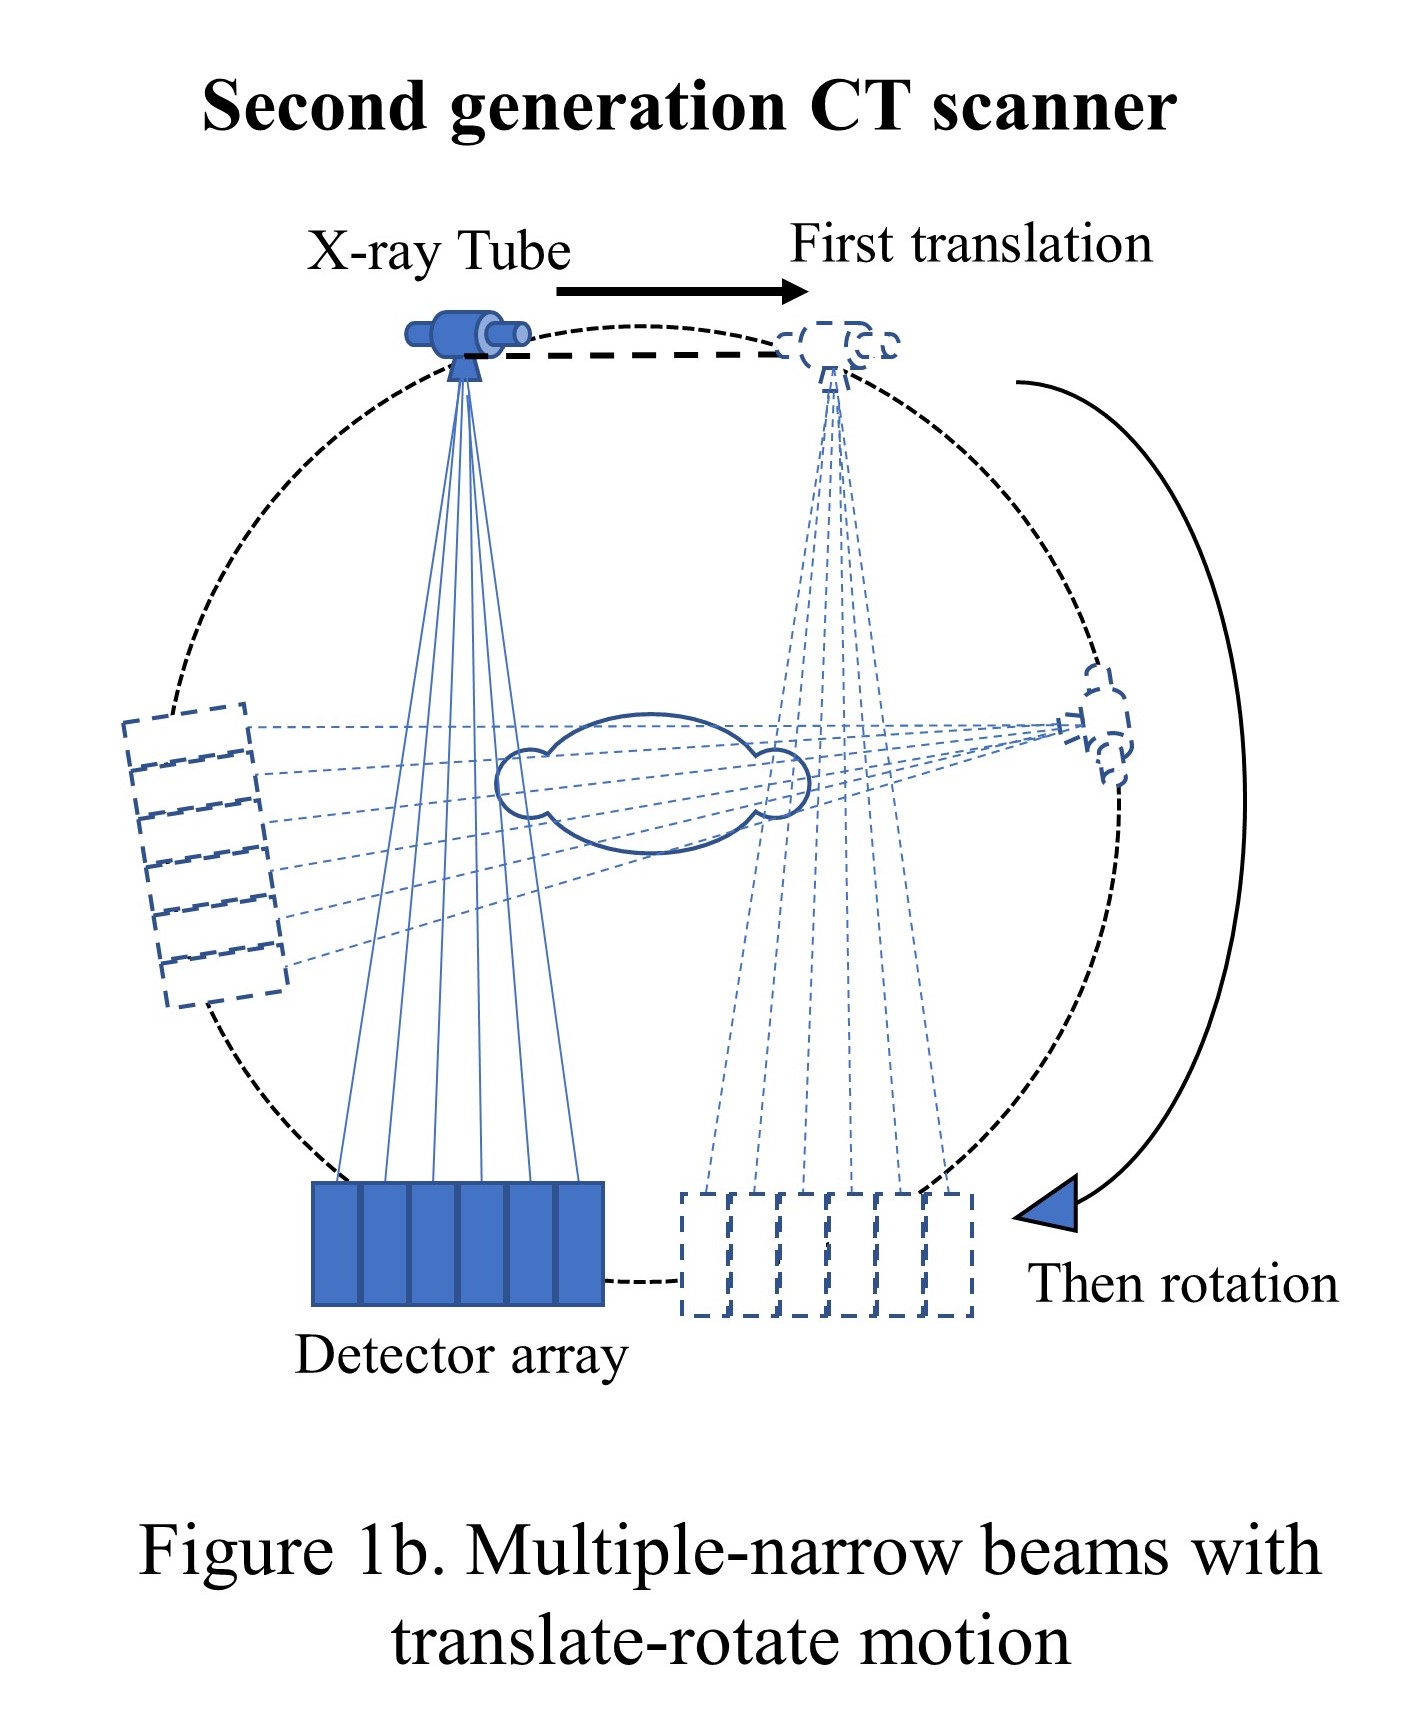
The initial CT scanner developed at EMI Corp (a British electronic firm) had one X-ray tube with one sodium iodide scintillator detector and was called the first-generation CT scanner. The tube and the detector were linearly translated and then rotated with a 1-degree increment to collect 180 views over 180 degrees, unlike 360 degrees for the current scanners. The pencil beam had 3 mm width and 13 mm length and took around 5 or 6 minutes to complete the scan (see "Narrow beam with translate-rotate motion"). To reduce the data acquisition time, the second-generation CT scanners were introduced in late 1974 with the same translation-rotational motion but with a multi-detector system that formed multiple narrow beams (see "Multiple-narrow beams with translate-rotate motion").[16]
In late 1975, with a 30-detector system, the acquisition time was reduced to 20 seconds. However, the heavy X-ray tube and associated electronics were causing frequent misalignments in the hardware due to the fast translational and rotational movements and bringing severe artifacts in the images. This need paved the way for 3rd generations of CT scanners.
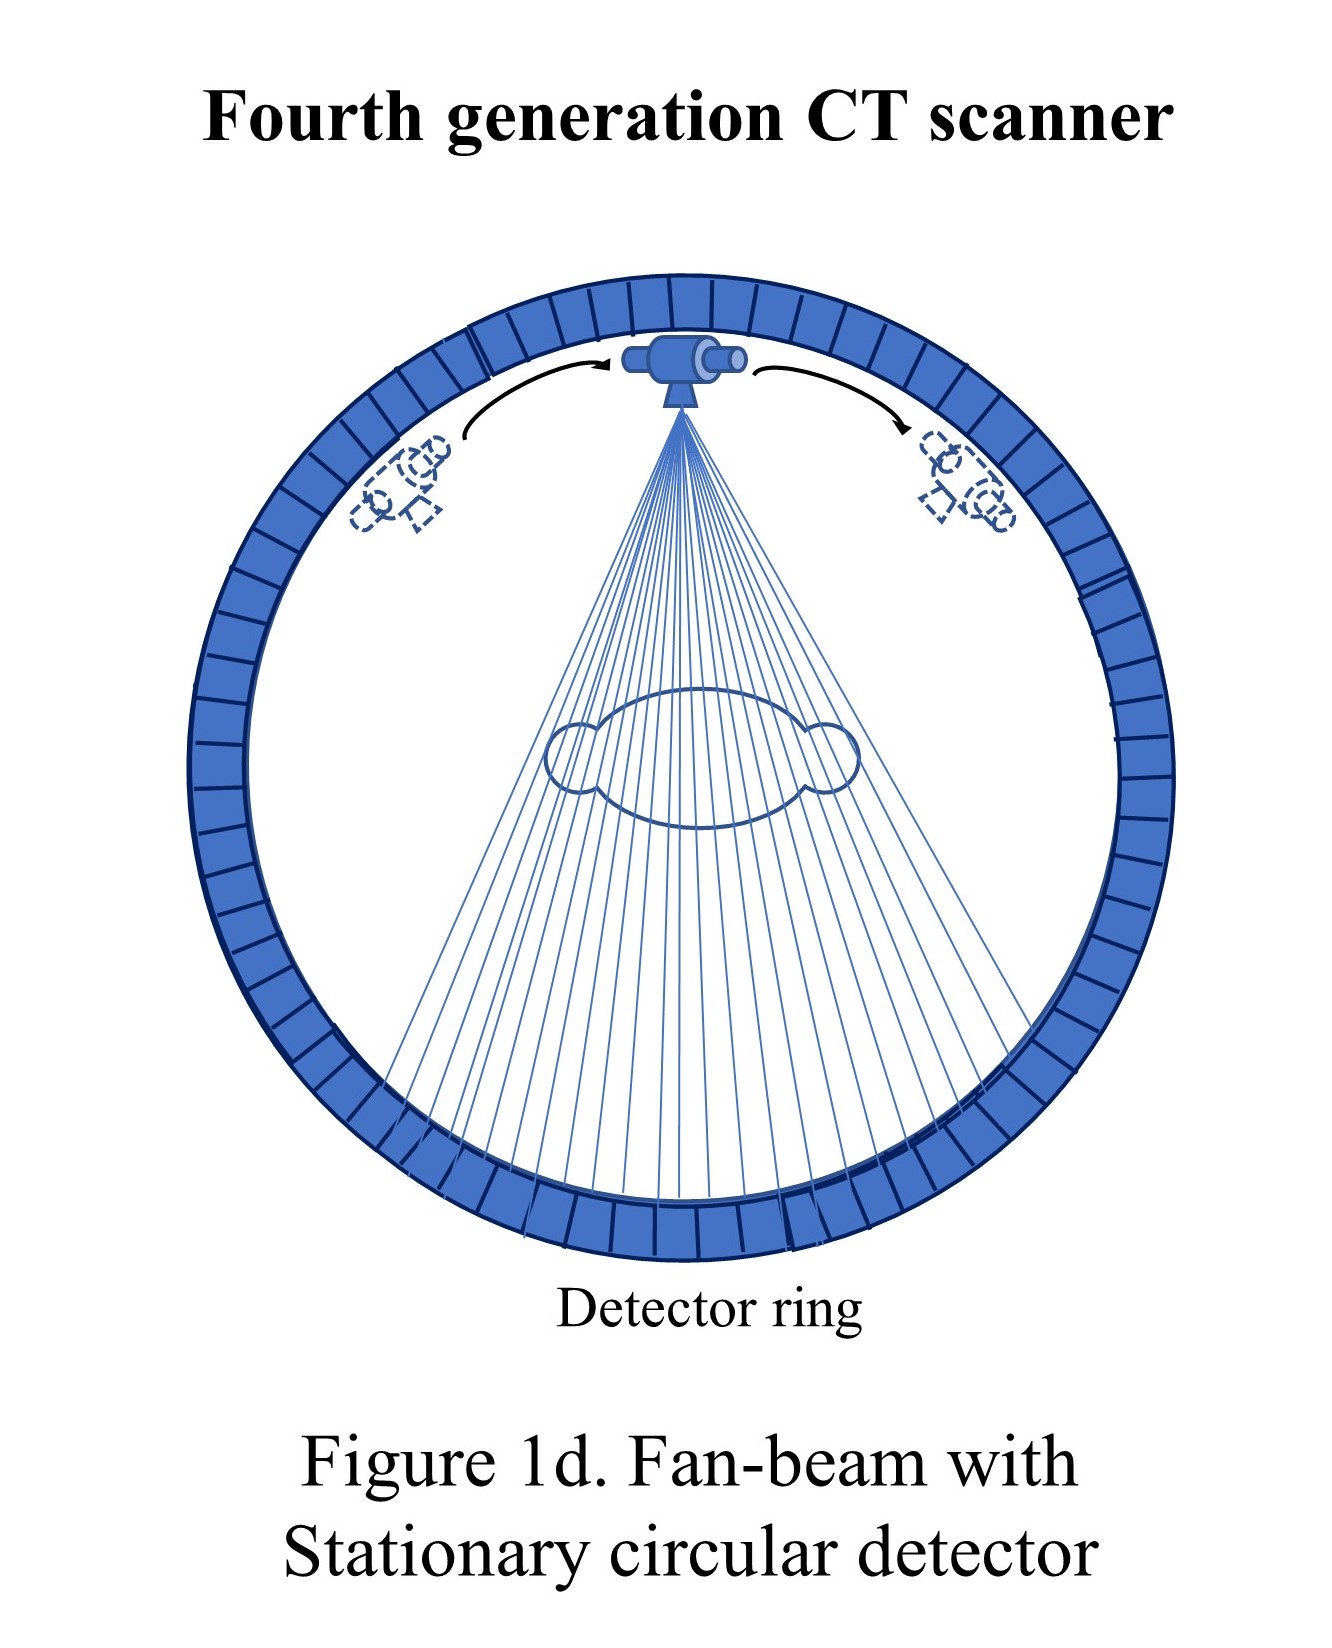
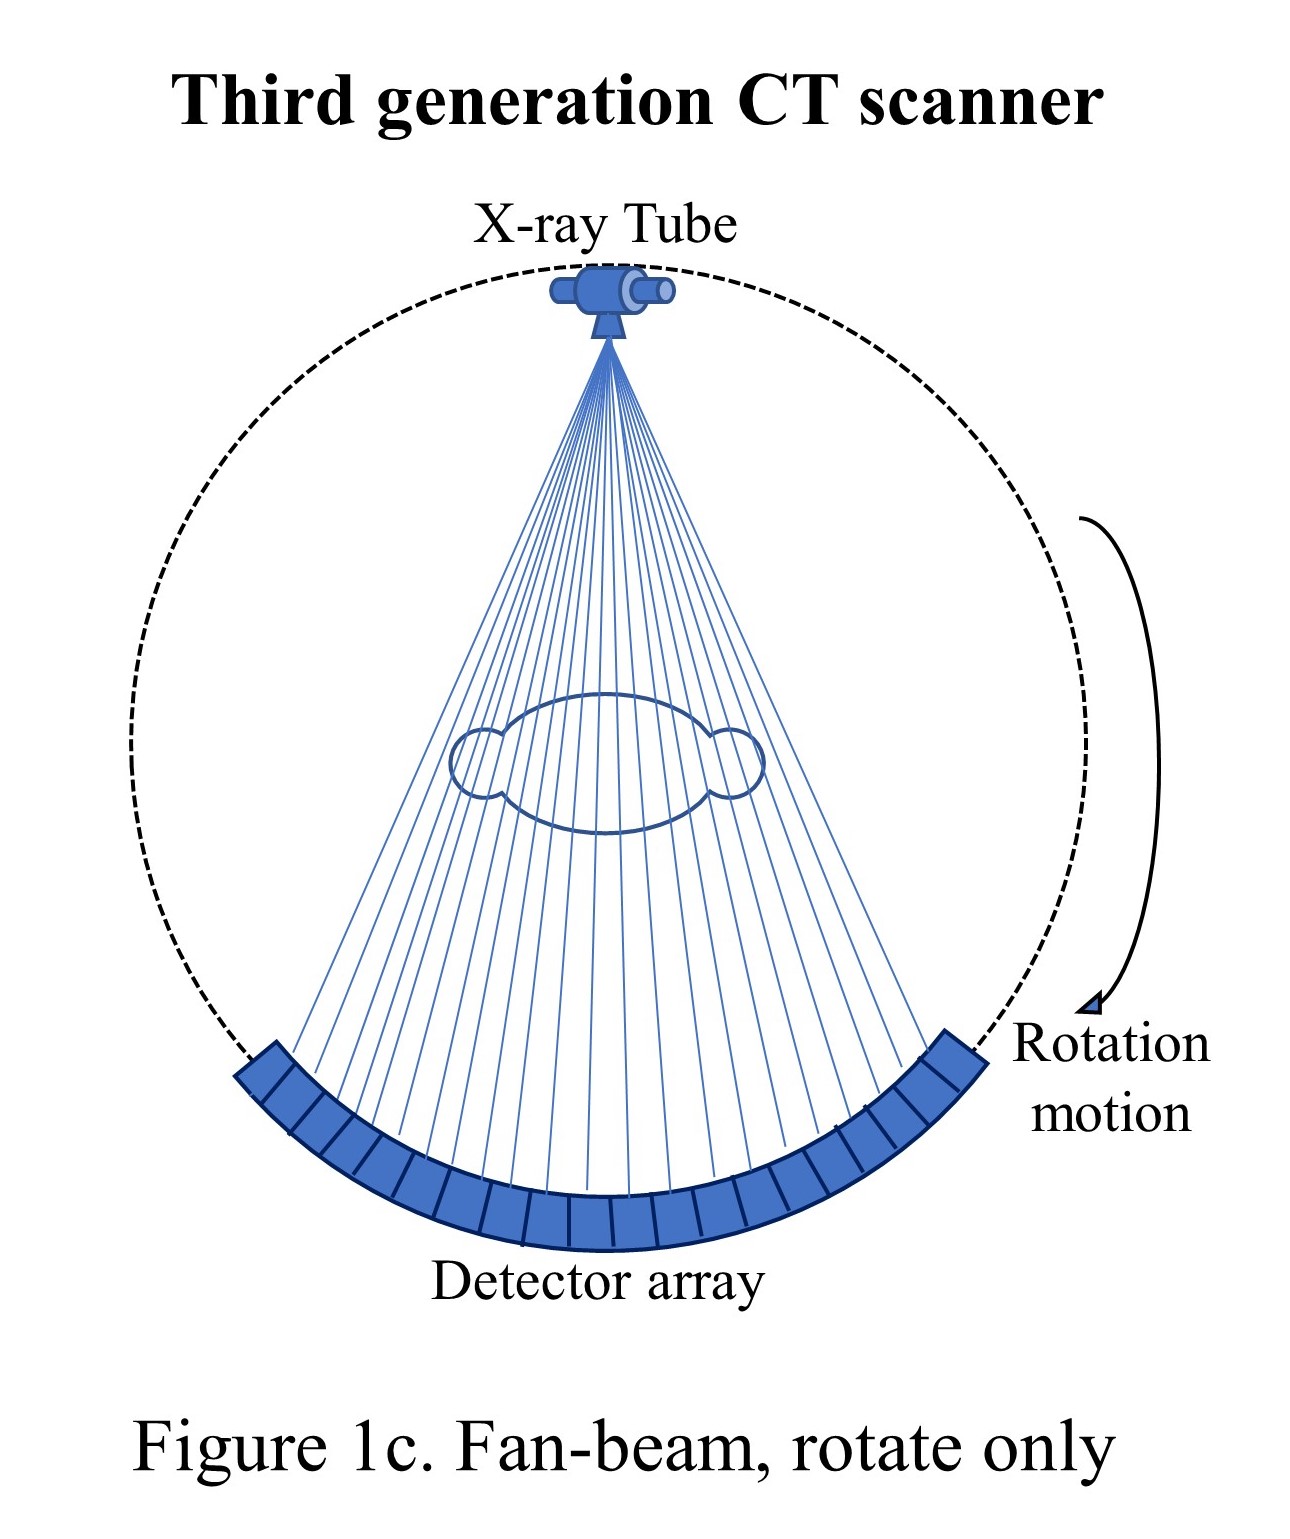
The third generation of CT scanners was introduced in late 1975, eliminating the translational motion and performing the only rotational motion. The X-ray beam was widened as a fan beam to cover the whole patient in the field of view (FOV) using an array of detectors and took less than 5 seconds to perform the acquisition.[16]
The tube and detector assembly were stationary concerning each other while rotating the whole set-up around the patient (see "Fan-beam, rotate only"). These models used a power supply to the X-ray tube with electric cables, and the length of the cable restricted the continuous circular motion, which forced the scanner to move clockwise and counterclockwise to acquire adjacent slices. The heavy gantry's continuous acceleration and deceleration limited the scan speed to approximately 2 seconds per rotation. However, this motion caused detector stability issues and image artifacts and led to the investigation of 4th generations of CT scanners. Though the third-generation scanners became very popular, and today's state-of-the-art scanners are based on the third-generation CT scanners only with hardware refinements such as slip-ring technology and multiple-detector rows.
The fourth generation of CT scanners was introduced in 1976, where the detector formed an enclosed stationary ring, and the X-ray tube rotated in a circular motion around the patient inside that ring and achieved a 1-second scan duration (see "Fan-beam with stationary circular detector"). However, the tube required a large ring of 170-180 cm to maintain sufficient tube-patient distance. The full circle detector ring increased the cost of the scanner considerably; however, the spatial resolution could be reached at around 4 mm. Also, the scatter correction problem could not be solved in this generation.
The electron beam CT scanners (EBCT) was introduced in 1984 for ultrafast cardiac scans and completed the scan in 10 to 20 milliseconds to freeze the heart's motion. The system had no mechanically moving part and was sealed in a vacuum, similar to cathode-ray tubes. The high-speed electron beam is focused and deflected by carefully built coils to sweep around the target ring. The fan-beam X-rays are produced and collimated to the set of detectors positioned in an arc of 216 degrees. 8 cm of coverage along the patient axis is obtained for the heart. However, the higher equipment cost and poor image quality for general imaging limit the use of EBCTs.
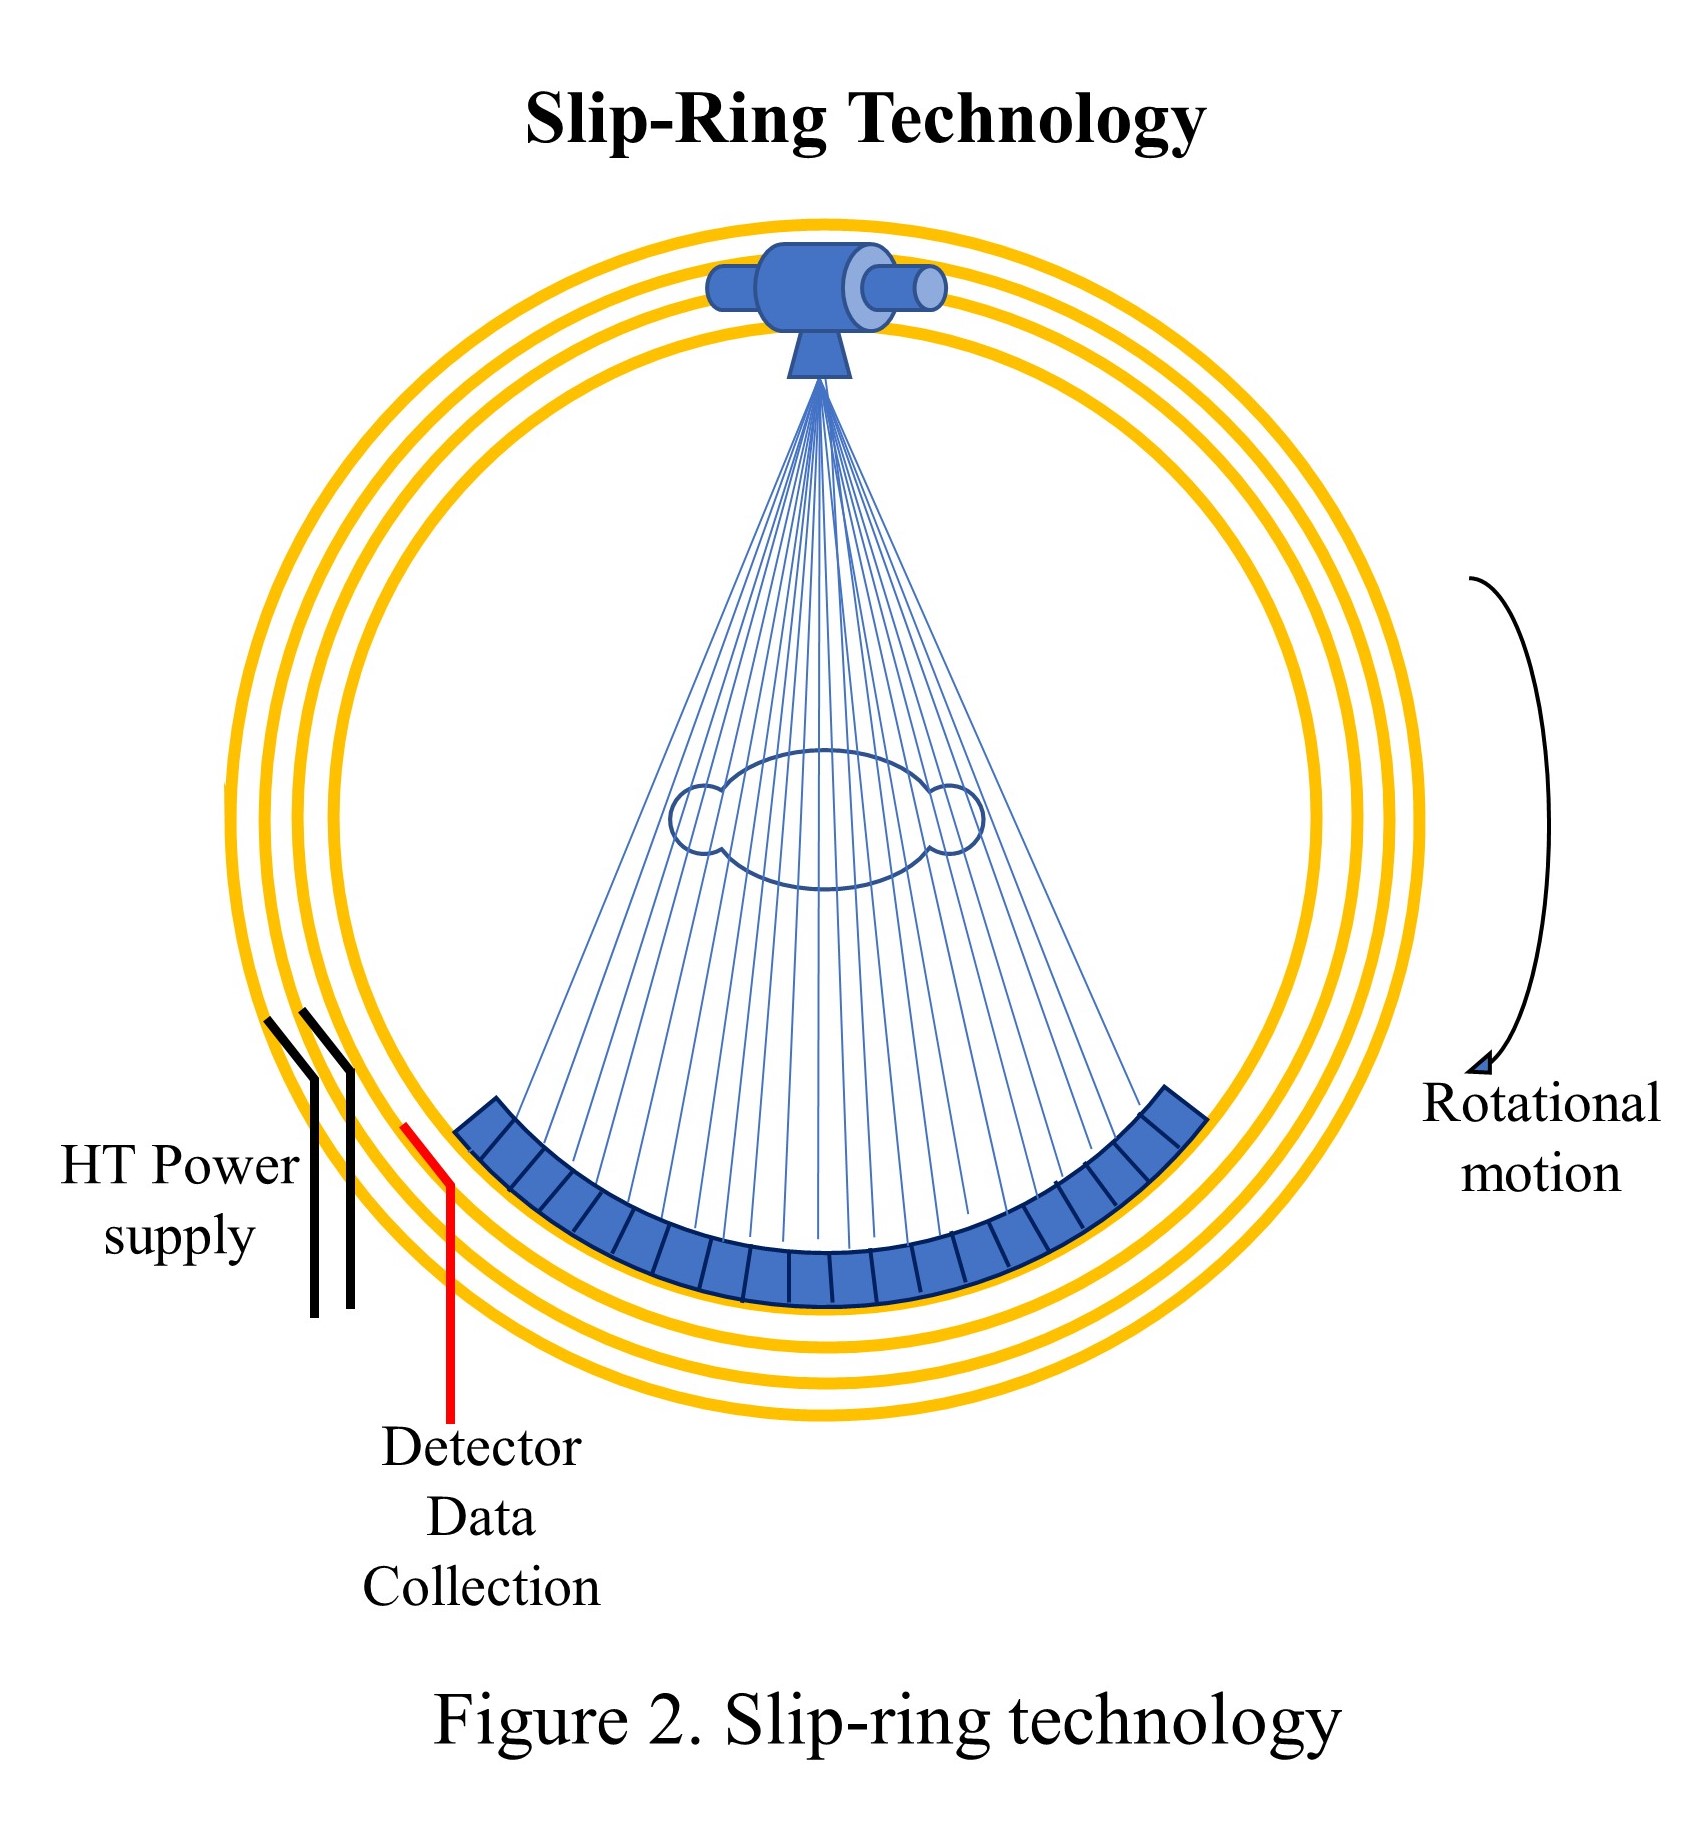
Until 1987, cables were used to supply the power to X-ray tubes and communicate detector signals. The rotation was coming to a halt every after 360 degrees, and the cables were looped onto a drum, released throughout the one rotation, and then spooled back in the opposite direction. Scanning, braking, and reversal took at least 8 to 10 seconds for each cycle, with only 1 or 2 seconds dedicated time for data acquisition. As a result, the temporal resolution was poor compelling longer procedural duration. The slip ring technology, first introduced in 1987, eliminated interscan delays and permitted continuous nonstop rotation. The slip ring is a circular ring that transfers power and data signals from the stationary part to the rotating part of the scanner (see "Slip-ring technology").
The slip ring technology led to the foundation of spiral CTs, and the first, became available in 1990; however, its clinical acceptance took another two years.[17] In a conventional CT scanner, the collimated X-ray beam is rotated in a circular motion around the object or the patient to measure the attenuation profiles from many angular positions and generate various image planes. The images are reconstructed, and the object is pushed for a small increment within the gantry for the next measurement. This procedure is repeated, and the high-quality images are generated slice by slice. This imaging method is called axial imaging or the step-and-shoot method and takes a longer duration. During the scan, the patient should not move to avoid blurry images or motion artifacts. Shorter scan duration remained a primary requirement to avoid motion-related artifacts, which led to the invention of spiral CT scanners.
The object is continuously moved through the gantry in Z-direction in spiral CTs. In contrast, the X-ray tube and detector assembly move around the object in a circular rotatory motion in the XY plane to acquire the images continuously (see "Spiral CT machines"). The volume covered in a particular number of spiral turns is represented by a single data set. The spiral CTs are also called helical CTs. Technically or practically, there is no difference between the two terms, and it is only the CT manufacturer naming it differently. The spiral CTs allowed the entire organ to be imaged in a single breath-hold.
A concept of "pitch" is introduced in helical CTs to define the table movement speed and the covered slice thickness. It is defined as "distance traveled by the table" in one 360 degrees gantry rotation divided by "the beam collimation." The pitch has no unit. For example, suppose the table moves 5 mm in one second, the beam collimation is 5 mm, the pitch stands at 1, and the entire X-ray helix is covered with X-ray exposure. Whereas, if the table moves 7.5 mm during one rotation of the X-ray tube and the beam collimation is 5 mm, the pitch would be 1.5.
Whenever the pitch is more than 1, there is a gap in the X-ray helix; however, the entire volume is still covered. This allows a faster scan with a lower radiation burden to the patient but certainly compromises image quality. A balance between image quality and the speed of acquisition should be maintained. In another example, if the table moves 4 mm in one rotation and the beam collimation is 5 mm, the pitch would be 0.8. There would be an overlap in X-ray exposure and the exposed area gets more radiation. The pitch values generally vary from 0.7 to 1.5, depending on the study.
Multislice CTs
The first modern multislice CTs (MSCT), or "multiple-detector-row CT" (MDCT) scanners, were introduced in late 1998; however, the concept was introduced in 1992 (twin CT).[18] It contains a rotating arc of detectors and the X-ray tube(s), allowing volumetric coverage of data acquisition with thin slices. The detectors are placed along the Z-direction in multiple rows (see "Multi-slice CT Scanners"). The initial scanners had 16-rows of detector elements with 1.25 mm or 1 mm width along the z-axis with total coverage of 20 mm. Different vendors used flexible combinations of widths such as 1.25 mm, 2.5 mm (1.25 × 2), 5 mm (1.25 × 4), 10 mm (2.5 × 4), 20 mm (5 × 4) to create 4-slice data channels, as handling of 16-slice data was not feasible at that time. As the capabilities increased, in 2003 - 2004, the manufacturers introduced 6-, 8-, 16-, 32- and 40-slice models. In 2005, 64-slice models were also introduced with a total z-axis coverage of 32-40 mm depending upon available slice thickness of 0.5 mm to 0.625 mm.[18]
Subsequently, 2007 to 2008 saw 128-, 256-, 320-slice, and dual-source CT scanners with z-coverage of up to 16 cm.[19] By 2012, Toshiba medical (now Canon Medical System) introduced a 640-slices CT scanner, which was digitally enhanced from 320-slice to 640-slice with double-slice technology and coneXact™ reconstruction algorithm, though the z-axis coverage remained the same at 16 cm.[20]
Currently, commonly available CT scanners are 16-, 32-, 40-, 64- and 128-slice, with less commonly available 256- and 320-slice CT scanners as their cost is significantly higher. Commandeur et al. (2019) compared different state-of-the-art models with their technical specifications and showed available tube rotation time up to 0.270 seconds, temporal resolution up to 0.135 seconds, and slice thickness up to 0.5 mm depending on model to model. Many such systems allow simultaneous acquisition of the whole organ, such as the heart, brain, blood vessels, joints, etc., due to larger Z-coverage. The best reported in-plane spatial voxel dimensions of state-of-the-art MSCTs are 0.23–0.4 mm and 0.3 mm in the Z-direction.[15]
X-ray Production
German physicist Wilhelm Conrad Roentgen discovered the first X-ray tube in November 1895.[21] Though the design of X-ray tubes has changed considerably since its inception, the basic principles remain the same. The early X-ray tubes were unreliable and inefficient. In 1913, an American Physicist Dr. William David Coolidge, used the thermionic emission phenomenon to improve the release of electrons from filament using electric current and accelerated towards the anode to produce X-rays. This method of production is the prototype for the current generation of X-ray tubes.
The electrons released from the heated cathode are accelerated towards the high voltage anode. This flow of accelerated electrons is called tube current. The electrons interact with the anode and X-rays are produced in all directions, but they are collimated to emerge out from a particular direction and form a beam. The number of electrons liberated from the cathode depends upon the temperature of the filament, which is regulated by the electric current to the filament.
For heating the filament, modern X-ray tubes receive 4 to 5 amperes of current. When there is no voltage difference between the anode and cathode, the thermionic emissions remain in the vicinity of the cathode, forming a cloud of electrons. These electrons travel only when there is a high electrical potential difference in kilovoltage (kV).
Once the potential difference is applied, the electrons rush toward the anode and generate kinetic energy while moving towards the anode. The electron flow from the cathode to the anode forms an electric current and this is in the range of 25 – 1000 milliampere (mA). The cathode is surrounded by a focusing cup, which deflects electrons at a specific location on the anode, called the focal spot. The size of the focal spot is an important factor and affects the image quality and sharpness of any X-ray imaging system.[22] A smaller focal spot gives better image quality. Routine diagnostic CTs have 2.0 mm of focal spot size.
The tube voltage kV determines the energy of X-rays. The X-rays have energy varying from 0 keV to the maximum or peak applied voltage (kVp). Since X-rays, less than 20 keV are not useful for imaging and only add to additional radiation burden without any contribution to the image quality, they are stopped using a filter, usually made up of aluminum, and placed at a tube window. Also, the amount of electricity (mA) used to heat the coil for a particular duration (seconds) determines the total number of X-rays emitted. The product of these two terms is called mAs or milliampere-second.
Tungsten coils have remained the choice of material to act as a cathode in a chemically and physically harsh environment; however, a thin layer of tungsten on graphite substrate is commonly used as anode material.[21] Tungsten allows heating temperatures beyond 2000 degrees Celsius and is a good conductor of heat & electricity. This element has a high atomic number (Z =74). The good conduction of heat allows the anode to remove a large amount of thermal energy generated during electron interactions.
The good electrical conductivity keeps electrons flowing freely and does not allow them to build upon the anode surface to create repulsive conditions for the incoming electron stream. The higher Z materials tend to release electrons easily. Since only 0.2 percent of thermionic electrons generate characteristic and bremsstrahlung X-rays, a balance of 99.8 percent of electrons release their kinetic energy in heat, and therefore a huge amount of heat is generated within the tube; this creates the need for a material having a high melting point (Tungsten has 3370 degrees Celcius melting point). Gold (Z=79) and molybdenum (Z=42) are other traditional target materials. The anode and cathode assembly are housed within an evacuated glass or ceramic tube (see "Production of X-rays"). The vacuum within the tube helps prevent the interaction of electrons with any gas molecules.
CT Detectors
The X-rays generated from the X-rays tube are read by the detectors placed opposite to this in an arc formation. These detectors are made up of an inorganic transparent ceramic detector and chosen based on their qualities of good light output, relatively lower afterglow effect, and resistance to the damage created by the radiation over prolonged use. Some of the commonly used materials are cesium iodide thallium activated [CsI (Tl)] crystals, cadmium tungstate (CdWO), gadolinium oxysulfide (GdOS), yttria, and gadolinia with europium activated (Y, Gd)O: Eu or YGdEuO. General Electric (GE) Healthcare has used (YGd)O in many CT scanners, whereas Siemens has used proprietary material Ultra-fast Ceramics (UFC) and Stellar detectors.
The scintillation photon generated by the ceramic detectors is converted into electrical signals by photodiodes. These semiconductor devices work similarly to photomultiplier tubes (PMTs) by converting light photons into the current.
Hounsfield Unit
When X-rays pass through the tissues, they are attenuated, and a linear attenuation map is generated from the 360 degrees of rotation of the X-ray tube and detectors. The same is used for reconstructing the image in CT technology. The relationship between transmission intensities for pre and post-patient and the linear attenuation coefficient is as follows:
- I = I0 exponential to the power(-ux)
Where I0 and I are pre-and post-patient photon intensities, x is penetrating path distance along with the patient, and u is linear attenuation coefficient. A reference linear attenuation coefficient of water is set to 1, and a relative number is generated depending on the density of the material in consideration. This relative number is called as CT number or Hounsfield Unit (HU) and is calculated with the formula below:
- HU = [(umaterial - uwater)/uwater] × 1000
If we place the linear attenuation coefficient of water as µwater in the above equation,
- HU = [(uwater - uwater)/uwater] × 1000
therefore, the HU of water is 0.
The attenuation coefficient of vacuum is 0, and since air has relatively very small attenuation, it is also approximated to 0. Therefore, equation 2 for air is:
- HU = [(0-uwater)/uwater] × 1000 = -1000
In most CT systems, the CT numbers vary from −1000HU to +1000HU for different tissues. Since the lung is mostly filled with air, its HU value varies between -400HU to -900HU, the soft tissues have around -80HU to 80 HU, and the softer and spongy bones (trabecular bones) have HU values between 100 to 300, whereas harder or cortical bones have it in a range of 300HU to 1000HU. The metallic implants have an HU value of around 1000, whereas the HU value for iodinated CT contrast is between 100 and 600.
The Physics of Hybrid Imaging
In many clinical conditions, functional imaging modalities such as SPECT and PET provide more information than anatomical imaging modalities such as CT and MRI. But these modalities often lack detailed anatomical information. In the 1980s, one of the solutions to this problem was to acquire images separately and merge them using computers. However, these image sets often get misregistered and lead to errors in interpretation.
In the early 1990s, Hasegawa led a group which used a diagnostic CT scanner and conventional gamma camera with a common patient table for sequential imaging of SPECT and CT. But the first commercial SPECT-CT was introduced by General Electric (The GE Discovery VG Hawkey) in 1999, and now the SPECT-CT is available with different multi-detector CT technology such as 2-, 4-, 6-, 16-, and 64-slice systems.[23]
Similarly, combining PET with CT was also suggested in 1991, but the first working prototype PET/CT scanner was developed in 1998. The first commercial PET-CT was available in 2001 with a single-slice CT system, but now the PET-CTs are available with 128-slice of diagnostic CTs.[24]
SPECT-CT
CT imaging complements the functional information of SPECT in many ways, such as anatomically localization of radiopharmaceutical distribution, attenuation and scatter correction, and determination of the impact of partial volume effect because of the low spatial resolution of the SPECT system and converting quantitative SPECT images into standardized uptake values (SUVs). The SPECT is a rotating gamma camera that determines the radiotracer distribution and quantifies the same in 3-dimensional images.
The gamma camera technology has not been changed much since its inception by Hall Anger in 1958. In 1963, Kuhl and Edwards demonstrated the first SPECT design, and since then, many configurations have been tried, including rotating patient chairs, translating detectors, etc.[23] But the SPECT using a rotating gamma camera was introduced in the late 1980s (between 1977-1980).
The gamma camera, also called an Anger camera or a scintillation camera, consists of the detector (s), photomultiplier tubes (PMT), a pulse-height analyzer, an anti-coincidence circuit including amplifiers, a positioning circuit, and a computer system (see "The Gamma Camera"). The detector is covered with a collimator and coupled with an array of photomultiplier tubes for positional information. The collimators are made up of lead or tungsten and come in different configurations such as low-energy high resolution, low-energy all-purpose, high energy, and pin-hole collimators for different users' needs.
Only photons moving parallel to the collimator holes reach the crystal and absorb it. The incident radiation is converted into light photons by scintillator detectors, which are further converted into electrical signals by PMTs to be ready by the subsequent electronics. The commonly used detector configuration is a dual detector system; however, single or triple detector systems and organ-specific cameras are also available. The gamma camera allows static planar imaging, whole-body scan with continuous slow-moving patient table, and the SPECT with detectors heads at various angles such as 90 degrees, 120 degrees, and 180 degrees.
The spatial resolution of a gamma camera is limited by many factors, including the detector thickness, collimator construction, the patient to collimator distance, the energy of the radioisotope, and the size and density of the organ or the body being imaged. However, the sensitivity is limited mainly by collimators and keeps it around 100 to 200 counts/second/Mega Bequerrel (MBq) or 0.01 to 0.02 percent for gamma-energy of 140 keV. The energy resolution of NaI (Tl) detectors has around 10 percent in the range of 0.1 to 1.0 MeV photons.
Photon Scatter
Approximately 20 to 50 percent of all detected events by the Anger camera are scattered within the body, and the directional changes allow for mispositioning. This degrades the image quality and increases the background with a decrease in contrast. This is one of the main reasons scatter correction techniques are required.
Photon Attenuation
The gamma-photons are attenuated within the body, on the collimators, and within the detector assembly. The attenuation is dependent on photon energy and the electron density, i.e., the Z number of the attenuating material, whereas the attenuation coefficient is the measurement of probability where a unit length of material attenuates the photon.
In CT, the X-ray radiation beam is well collimated to fall on the detector and called narrow-beam collimation. In Nuclear Medicine, the source is within the body and emitted in all directions and falls on the detector, which is only a part of total emissions as the detector is in a particular direction. This uncollimated condition is called broad-beam collimation and leads to lower effective attenuation. The conditions of broad-beam and narrow-beam are important while applying attenuation and scatter corrections in SPECT reconstruction data. They possess a large impact on the reconstructed image.
Corrections for Photon Attenuation and Scattering
The CT number or Hounsfield Unit (HU) from generated CT data is used for attenuation and scatter corrections in SPECT-CT. Generally, both the corrections are performed in separate steps. The energy of X-ray photons and the photons emitted by the radioisotopes has a different range of energies. The energy of gamma-photons used in imaging has higher than X-ray photons.
The conversion of attenuation coefficient from CT number to the gamma-energy is a bilinear relation but behaves linearly at a threshold value of 0. The bilinear scaling implementation requires preprocessing of CT data and the creation of two distinct data sets separated from the threshold value where the relationship changes. This can be easily performed by separating CT numbers at a threshold number and applying regression equations to each image set. Then recombining both data sets finally corrects the data for attenuation.
The scatter correction can also be performed to improve the reconstruction accuracy. The techniques which have been validated for SPECT scatter correction are the "Triple-energy-window (TEW) method, the transmission-dependent scatter correction (TDSC) and using the calculations of physics of scattering. The TDSC and the scattering physics calculations both use CT data to improve accuracy.[25][26][27][28]
PET-CT
The PET-CT scanners use positron-emitting radionuclides and are configured in sequential gantries or in-line gantries for PET and CT machines and share the same patient couch. The Positron-emitting radionuclides, also called PET radionuclides, are neutron-deficient and achieve stability by converting a proton into a neutron (n), a positron (a positive electron), and an electron neutrino. The positron loses its kinetic energy and recombines with one of the orbital electrons in surrounding tissues.
The rest mass-energy of the positron-electron pair (a transient atom called positronium) is converted into two 511 keV annihilation photons, emitted in approximately opposite directions (approximately 180 degrees). This pair of gamma photons are detected by the block of detectors placed in a circular ring. Various scintillation crystals such as bismuth germanate (BGO), lutetium oxyorthosilicate (LSO), and gadolinium oxyorthosilicate (GSO) are used as PET detectors.
A coincidence circuit is used to record the valid events within the coincidence timing window. Typically, the coincidence timing window is 6-12 nanoseconds. The event detection is stored in a sinogram matrix to represent the activity distribution at a particular angle and axial position. An algorithm is used to reconstruct the sinogram data and represent the activity distribution inside the patient body. Therefore, the radiopharmaceutical distribution, which follows certain physiological pathways and localizes within the body, can be mapped and measured.
For medical applications, commonly used positron-emitting radionuclides are Fluorine-18, Gallium-68, Oxygen-15, Nitrogen-13, Carbon-11, and Rubidium-82. The energy range of these radioisotopes is 0.634 MeV for F-18 to 3.4 MeV for Rb-82. The physical properties of these radionuclides are summarized in table 1.
Table 1: Physical properties of commonly used PET radionuclides[29]
| Radionuclide |
Half-life
(minutes) |
Decay Mode (in percent) |
Positron Energy in keV
|
Mean Positron Range in water (in mm) |
| F-18 |
109.8 |
Positron (96.9)
EC (3.1) |
634 |
0.6 |
| Ga-68 |
67.8 |
Positron (88.9)
EC (11.1) |
1.899 |
3.5 |
| C-11 |
20.4 |
Positron (99.8)
EC (0.2) |
960 |
1.2 |
| N-13 |
10.0 |
Positron (100) |
1199 |
1.8 |
| O-15 |
2.0 |
Positron (99.9)
EC (0.1) |
1732 |
3.0 |
| Rb-82 |
1.3 |
Positron (81.8)
EC (13.1) |
3378 |
7.1 |
*EC = Electron Capture
Sensitivity
The PET sensitivity is defined as the number of 511 keV photon pairs detected in unit time by the device from each unit of radioactivity present in the source.[30] It is measured in counts per second per kilo becquerel or cps/kBq. Since PET is a 3-dimensional imaging modality and uses electronic collimation of coincidence detection instead of absorptive collimators used in SPECT, the sensitivity increases significantly.
The sensitivity also increases by adding more detector material in thickness and axial extent. With a 50 percent increase in the thickness of LSO crystal (from 2 cm to 3 cm), the intrinsic sensitivity increases by 40 percent. Increasing a 30 percent axial extent increases the volume sensitivity by 78 percent. However, increasing axial thickness increases the number of PMTs and thereby the cost of the scanner.
The 5-Ring GE discovery IQ Gen2 offers PET axial coverage of 26 cm, whereas the newly introduced Siemens Biograph Vision Quadra offers 106 cm of the axial field of view (3.2 mm crystal element with 51 mm volumetric resolution) and allows total body (vertex to thigh) imaging in one position. However, commonly used PET scanners have 2 to 3 ring detectors, and a typical 3-ring GE Discovery IQ has a sensitivity of 7.78 cps/kBq.
Spatial Resolution
The positron physics, i.e., emissions and annihilation reactions, limits spatial, temporal, and contrast resolutions. Ideally, starting from the positron range, our equipment should map the origin of positron decay, whereas, in PET imaging, the radiopharmaceutical distribution map is generated for annihilated photons. This sets the lower limit in spatial resolution of the PET camera for any radionuclide used in imaging.
The second limitation is that both annihilation photons are assumed to be collinear; however, they come out at an angle of (180±0.25) degrees. For a typical PET scanner design, the non-colinearity can contribute to about 1.5 mm full width at half maximum (FWHM) for F-18.
Along with these two limitations, the PET resolution is further degraded by PET detectors' material, size, and design. This effect can contribute to about 2 mm resolution degradation. With detector pixel size in the range of 3.2 to 5 mm and 15 to 25 mm in thickness, the PET can provide spatial resolution in the range of 3.5 to 5 mm at the machine level.
Scatter and Randoms
If photons of different origins are registered as related events due to scattering from body tissues, these unrelated, erroneously counted events are called scatter events. The number of such events caused by scattering is called scatter fraction. This is the ratio of scattered events to total events. Random events are those events that are unrelated to each other but are counted as valid events due to coincidence timing window width.
These events are reduced or eliminated by modeling both processes. Scattered photons can be eliminated by identifying the lost energy in the scattering process and applying simple energy threshold rejection criteria. However, the random events can be counted from the singles rate, the coincidence timing window, or by direct counting of delayed events acquired out of the timing window. The current detector systems typically lead to 30 to 40 percent scattering fractions at the system level.[30]
The Attenuation and Attenuation Correction
On interaction with body tissues, the photons lose their energy by Compton scattering or the Photo-electric effect, and many of them are eliminated due to significant loss of energy. This loss in the counting of annihilation photons is called attenuation. An algorithm generated from CT transmission data compensates for such losses. However, the mean X-ray energy used in a clinical set-up is in the range of 70 keV, which is far less than the annihilation photons' energy of 511 keV and must be scaled to such a level.
Since the body has various tissues with different CT numbers, more than one scaling factor is applied to compensate for attenuation corrections. Generally, the CT scan is performed before the PET data acquisition, though the order can be changed, and an attenuation correction map is generated for the entire volume. The attenuation correction factors (ACFs) are formed by reprojecting the scaled CT images and then interpolating from CT to PET spatial resolution. However, serious mismatches can be generated for many reasons, including patient respiration, due to oral and intravenous contrast and metallic implants.