Continuing Education Activity
Normally, the T wave on an electrocardiogram (ECG) is representative of ventricular repolarization. Changes in T wave morphology can be indicative of various benign or pathologic conditions affecting the myocardium. Proper knowledge of T wave morphology is essential to successful evaluation and management of several conditions. This activity reviews the definition of an electrocardiographic T wave, explains how different clinical states can cause changes to T wave morphology, and highlights the role of educating interprofessional team members on the significance of T wave changes in order to improve patient care.
Objectives:
- Outline the physiology associated with the electrocardiographic T wave.
- Describe normal T wave morphology on a standard electrocardiogram.
- Review common clinical diseases that cause changes in T wave morphology.
- Explain the importance of educating interdisciplinary team members regarding the significance of electrocardiographic T wave changes.
Introduction
The T wave on an electrocardiogram (ECG) represents typically ventricular repolarization.[1][2] However, various waveform morphologies may present as an indication of benign or clinically significant injury or insult to the myocardium. Understanding the differential diagnosis for T wave discrepancies is crucial to the successful and safe management of various cardiac pathologies. This article summarizes the ECG T wave in its entirety, including how it is defined, measured, and how it may vary.
Etiology
Normal T-wave Etiology
Normally, the T wave is formed at the end of the last phase of ventricular repolarization. Ventricular repolarization is the process by which the ventricular myocytes return to their negative resting potential so they can depolarize again. While this phase of the cardiac cycle is rapid, an upright low amplitude broad hump following the QRS complex is seen in normal T wave morphology.
Abnormal T-wave Etiology
Abnormalities in the T-wave may represent variations of normal cardiac electrophysiology or signs pathology. Tall T-waves (also called hyper-acute T waves) can be an early sign of ST-elevation myocardial infarction. The morphology of the T waves can begin to broaden and peak within 30 minutes of complete coronary artery occlusion, and thus may be the earliest sign of myocardial infarction on the EKG. The T waves will be broadened and peaked in the leads corresponding to the artery occlusion.[1] Tall T waves can also be signs of ventricular hypertrophy, depending on the distribution in the precordial leads. Additionally, T waves may be tall as a normal variant. Due to this, it is crucial to compare all ECGs with elevations in T-wave morphology to a prior study. Keep in mind elevated T waves may even occur in as normal variation in young patients and athletes, typically in the precordial V2-V4 leads.[3]
Inverted T waves are associated with myocardial ischemia. The inversion of a T wave is not specific for ischemia, and the inversion itself does not correlate with a specific prognosis. However, if the clinical history is suggestive of ischemia in the setting of inverted T waves, this is correlative.[4] Wellen syndrome is symmetrically inverted T waves in anterior precordial leads; these T waves suggest a severe narrowing of the left anterior descendent coronary artery at a proximal location. Recognition of this condition is vital to prevent a large anterior STEMI.[5] However, Wellens signs can be seen in various other pathologies such as pulmonary disease, so appropriate clinical correlation is imperative.
Hyperkalemia is a condition that can cause peaked T waves. Depending on the degree of hyperkalemia, the peaked T-waves may range from a low amplitude to tall peaks to a sinusoidal pattern on ECG. The mechanism of the T-wave morphologies is through inhibition of the positively charged extracellular potassium on repolarization of the myocardium. In initial ECG changes in hyperkalemia, the T waves become narrow, pointed, and tall; these changes will be seen in all leads on the EKG. As the hyperkalemia progresses, other EKG abnormalities may occur: decreased P wave height, a widened QRS, PR prolongation, and eventually, the ECG may become sinusoidal.[4][6]
Several medications are indirectly associated with T wave abnormalities. Medications such as antiarrhythmics, digoxin, and diuretics can cause electrolyte abnormalities leading to changes in T wave appearance. A key to differentiating ischemia/infarction from electrolyte-induced T-wave changes is through the distribution of changes on ECG. Electrolyte abnormalities cause diffuse changes in the T-wave morphology throughout the ECG rather than specific to a coronary artery distribution.
Diffuse, deep, symmetrically inverted T waves may be seen in a severe central nervous system trauma or pathology. These are called cerebral T waves. Conditions associated with cerebral T waves are an ischemic stroke, intracranial bleed, and traumatic brain injury.[4] Left bundle branch block innately causes T wave to deflect in the opposite of the major deflection of the QRS. Diffuse T wave inversions on an ECG can be associated with pericarditis. The changes on an ECG for pericarditis take place over 2-3 weeks, initially with ST-elevation, then T wave inversion, with eventual resolution of the ST segment.[7] Massive pulmonary embolism can cause right ventricular strain, which can manifest as the classic S1Q3T3 (deep S wave in lead I, Q wave and T wave inversion in lead III).
Epidemiology
Approximately 15.5 million Americans over the age of 20 have coronary heart disease, according to the 2016 Heart Disease and Stroke Statistics update from the American Heart Association (AHA). It is estimated that a myocardial infarction occurs about every 42 seconds in the United States.[8]
A study was done by Sanchis-Gomar et al. to evaluate the prevalence of hyperkalemia, a common cause of T-wave changes in the general population. The study included approximately 2.2 million patients to find the prevalence of hyperkalemia. Sachis-Gomar et al. were able to deduce that approximately 1.55% or 3.7 million Americans have hyperkalemia. The rates were elevated in those with chronic kidney disease, heart failure, diabetes, and hypertension. About 6% of patients with chronic kidney disease and heart failure were found to have hyperkalemia.[9]
Pathophysiology
Normal T-wave Physiology
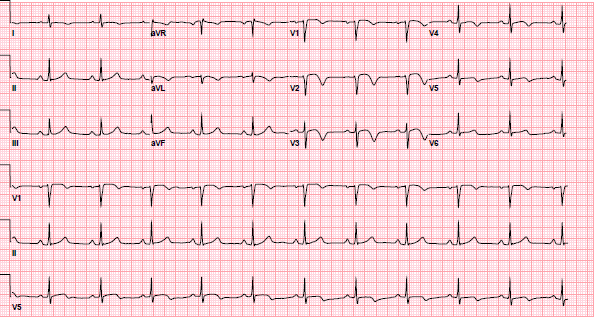
Normal T waves are upright in leads I, II, and V3-V6, inverted in AVR. Less than five mm in limb leads, less than ten mm in precordial leads, and variable presentations in III, AVL, AVF, and V1-V2.[2] This graphical depiction on ECG is associated with lead placement and the electrical pathways of the heart.
Abnormal T-wave Pathophysiology
T wave changes are secondary to electrolyte abnormalities in the myocardium since the ECG is representative of the electricity of the heart. The outflow of potassium from the myocyte during repolarization is necessary to restore resting membrane potential. In disease states such as ischemia, the Na/K-ATPase cannot function to restore this gradient; when there is hyperkalemia, the electrochemical gradient for potassium to flow out of the cell is skewed, altering the repolarization phase. These changes during phase three of the action potential are reflected by abnormalities in the T wave on an ECG.
Histopathology
Ventricular repolarization is depicted on the ECG in the form of a T-wave. Ventricular depolarization (phase zero) is the opening of Na channels, phase one is as these Na channels begin to close and K channels open. Phase two of the ventricular action potential is sustained by the opening of Ca channels. The repolarization (phase three), is caused by the closing of these Ca channels and the opening of K channels. The potassium flows out of the cell due to its electrochemical gradient, to restore the resting membrane potential near -88 to -90 mV.
History and Physical
As there are many different causes of T-wave abnormalities, there are just as many potential presentations. A thorough history and physical, along with a rigorous medication review, can provide essential information to suggest a specific diagnosis. For example, a history of prior episodes of chest pain with recent worsening in symptoms may indicate an ischemia component. A new or recently added medication such as digoxin may point suggest possible drug intoxication.[10] The temporality of the presentation is another essential part to assess the etiology of T-wave abnormalities. Acute onset of dyspnea with tachycardia after a recent surgery may suggest a pulmonary embolism. While the presentations above have clear cut symptoms on performance, it is important to remember that many times T-wave changes are asymptomatic as many causes of T-wave changes are non-pathological, such as normal variants or lead to misplacement.
Evaluation
An ECG is one aspect of the clinical evaluation of a patient. The assessment of the ECG should always be integrated into a complete diagnostic workup. Metabolic panels and biomarkers of myocardial ischemia are needed in scenarios of suspected ischemia or electrolyte abnormalities. If cerebral T waves are seen, a non-contrast enhanced CT scan is suggested to look for any acute bleeding or trauma to the central nervous system. If a pulmonary embolism is suspected, a CT angiography should be conducted.
Treatment / Management
Treatment options differ depending on the etiology of the T-wave changes. Some T-wave changes require no intervention. However, some causes of T-wave changes are associated with high morbidity and mortality without emergent intervention.
Ischemia and Infarction
If acute T waves are seen indicative of ischemia in a coronary artery distribution, management should be focused on reperfusion and treatment of the acute coronary syndrome.[11]
Hyperkalemia
In severe hyperkalemia in the presence of peaked T-waves, calcium gluconate should be administered promptly to stabilize the cardiac membrane, in hopes to prevent arrhythmia. Mild hyperkalemia without T-wave abnormalities can be managed with polystyrene sulfonate, a potassium binder, insulin which forces potassium intracellularly, or furosemide, which drives potassium out of the body through the urinary tract.[12]
Pulmonary Embolism
Pulmonary embolism (PE) is a common cause of T-wave changes. Treatment options for PE vary depending on the size and severity. Acute massive and submassive PEs should be considered for catheter-directed tPA. Smaller pulmonary embolisms in the absence of hemodynamic compromise or right heart strain can be found for systemic anticoagulation.[13] All institutions currently or planning on treating PEs in the future are encouraged to set up a pulmonary embolism response team made up of a cardiologist and pulmonologist. This team is designed to swiftly and accurately triage new PEs for appropriate treatment.[14]
Pericarditis
Pericarditis can be managed with ibuprofen and colchicine for at least three months. If recurrent, pericarditis, a longer course of treatment is recommended.[15]
Drug-drug interaction or Intoxication
Serum drug levels may help identify intoxication with a particular medication that may be causing ECG abnormalities. It is recommended to stop the drug if intoxication or drug-drug interaction is suspected while workup is being done. Some drugs have reversal agents. For example, dig immune Fab is the first-line agent for digoxin toxicity. It is an immunoglobulin fragment that binds with digoxin and neutralizes it.[10]
Differential Diagnosis
T-wave Inversion
- Normal variant
- Myocardial ischemia
- Ventricular strain
- Cerebrovascular injury
- Hypertrophic cardiomyopathy
- Idiopathic
- Left bundle branch block
- Right bundle branch block
- Ventricular beats
Peaked T-waves
- The hyperacute phase of myocardial infarction
- Prinzmetal angina
- Normal variant
- Hyperkalemia
- Left ventricular hypertrophy
- Left bundle branch block
- Acute pericarditis[4]
Prognosis
Prognosis depends mainly on the underlying etiology. T wave abnormalities seen on the EKG may be benign or represent severe, life-threatening threatening conditions. The ECG, combined with a thorough history and physical, will provide valuable information towards the etiology and prognosis for the patient.
Complications
The worst complication of T-wave abnormalities is a misdiagnosis of a serious T-wave pathology or delay in treatment intervention. Other possible complications include cardiomyopathy, myocardial ischemia or infarction, arrhythmia, tamponade, heart failure, and even death.
Consultations
Consultations with interventional cardiology would be appropriate in the setting of suspected myocardial infarction. It is recommended that a consult is placed to nephrology in the context of chronic kidney disease or severe hyperkalemia.
Deterrence and Patient Education
Patients must be educated on the signs and symptoms of ischemic heart disease and instructed to seek medical attention when these arise. The American Heart Association along with the American College of Cardiology are avid proponents for heart disease awareness. Millions of dollars go toward educating the public every year on this very topic.[16] However, it is essential that all healthcare providers regularly educate our patients on possible heart disease presentations. So our patient can seek help rapid, appropriate help.
According to the 2018 USRDS report, kidney disease is on the rise in the United States of America.[17] Chronic kidney disease is a common cause of electrolyte abnormalities and therefore may lead to T-wave changes. It is vital to educate our patients on appropriate risk factor modification through tight diabetic and blood pressure control. Primary prevention of kidney disease is essential. In those with previously developed kidney disease should be monitored closely for electrolyte abnormalities.
Enhancing Healthcare Team Outcomes
When working in an emergent situation, it is essential that communication between providers, on all levels of training, is in sync.[14] There is level I evidence to support maximization of interprofessional communication, and care coordination optimizes healthcare outcomes. [18] While an ECG is a valuable tool, also during the history and physical, it is vital that the appropriate diagnosis and early intervention be addressed. It is highly recommended protocols and algorithms are set in place at all institutions treating cardiac disease. This way the best outcomes for our patient can be achieved. [Level I]