Issues of Concern
Individuals who attempt to conduct research and choose an inappropriate design could select a faulty test and make flawed conclusions. This decision could lead to work being rejected for publication or (worse) lead to erroneous clinical decision-making, resulting in unsafe practice.[1] By understanding the types of variables and choosing tests that are appropriate to the data, individuals can draw appropriate conclusions and promote their work for an application.[3]
Variables
To determine which statistical design is appropriate for the data and research plan, one must first examine the scales of each measurement.[4] Multiple types of variables determine the appropriate design.
Ordinal data (also sometimes referred to as discrete) provide ranks and thus levels of degree between the measurement.[5] Likert items can serve as ordinal variables, but the Likert scale, the result of adding all the times, can be treated as a continuous variable.[6] For example, on a 20-item scale with each item ranging from 1 to 5, the item itself can be an ordinal variable, whereas if you add up all items, it could result in a range from 20 to 100. A general guideline for determining if a variable is ordinal vs. continuous: if the variable has more than ten options, it can be treated as a continuous variable.[7] The following examples are ordinal variables:
- Likert items
- Cancer stages
- Residency Year
Nominal, Categorical, Dichotomous, Binary
Other types of variables have interchangeable terms. Nominal and categorical variables describe samples in groups based on counts that fall within each category, have no quantitative relationships, and cannot be ranked.[8] Examples of these variables include:
- Service (i.e., emergency, internal medicine, psychiatry, etc.)
- Ethnicity
- Mode of Arrival (ambulance, helicopter, car)
A dichotomous or a binary variable is in the same family as nominal/categorical, but this type has only two options. Binary logistic regression, which will be discussed below, has two options for the outcome of interest/analysis. Often used as (yes/no), examples of dichotomous or binary variables would be:
- Alive (yes vs. no)
- Insurance (yes vs. no)
- Readmitted (yes vs. no)
With this overview of the types of variables provided, we will present commonly used statistical designs for different scales of measurement. Importantly, before deciding on a statistical test, individuals should perform exploratory data analysis to ensure there are no issues with the data and consider type I, type II errors, and power analysis. Furthermore, investigators should ensure appropriate statistical assumptions.[9][10] For example, parametric tests, including some discussed below (t-tests, analysis of variance (ANOVA), correlation, and regression), require the data to have a normal distribution and that the variances within each group are similar.[6][11] After eliminating any issues based on exploratory data analysis and reducing the likelihood of committing type I and type II errors, a statistical test can be chosen. Below is a brief introduction to each of the commonly used statistical designs with examples of each type. An example of one research focus, with each type of statistical design discussed, can be found in Table 1 to provide more examples of commonly used statistical designs.
Commonly Used Statistical Designs
Independent Samples T-test
An independent samples t-test allows a comparison of two groups of subjects on one (continuous) variable. Examples in biomedical research include comparing results of treatment vs. control group and comparing differences based on gender (male vs. female).
Example: Does adherence to the ketogenic diet (yes/no; two groups) have a differential effect on total sleep time (minutes; continuous)?
Paired T-test
A paired t-test analyzes one sample population, measuring the same variable on two different occasions; this is often useful for intervention and educational research.
Example: Does participating in a research curriculum (one group with intervention) improve resident performance on a test to measure research competence (continuous)?
One-Way Analysis of Variance (ANOVA)
Analysis of variance (ANOVA), as an extension of the t-test, determines differences amongst more than two groups, or independent variables based on a dependent variable.[11] ANOVA is preferable to conducting multiple t-tests as it reduces the likelihood of committing a type I error.
Example: Are there differences in length of stay in the hospital (continuous) based on the mode of arrival (car, ambulance, helicopter, three groups)?
Repeated Measures ANOVA
Another procedure commonly used if the data for individuals are recurrent (repeatedly measured) is a repeated-measures ANOVA.[1] In these studies, multiple measurements of the dependent variable are collected from the study participants.[11] A within-subjects repeated measures ANOVA determines effects based on the treatment variable alone, whereas mixed ANOVAs allow both between-group effects and within-subjects to be considered.
Within-Subjects Example: How does ketamine effect mean arterial pressure (continuous variable) over time (repeated measurement)?
Mixed Example: Does mean arterial pressure (continuous) differ between males and females (two groups; mixed) on ketamine throughout a surgical procedure (over time; repeated measurement)?
Nonparametric Tests
Nonparametric tests, such as the Mann-Whitney U test (two groups; nonparametric t-test), Kruskal Wallis test (multiple groups; nonparametric ANOVA), Spearman’s rho (nonparametric correlation coefficient) can be used when data are ordinal or lack normality.[3][5] Not requiring normality means that these tests allow skewed data to be analyzed; they require the meeting of fewer assumptions.[11]
Example: Is there a relationship between insurance status (two groups) and cancer stage (ordinal)?
Chi-square
A Chi-square test determines the effect of relationships between categorical variables, which determines frequencies and proportions into which these variables fall.[11] Similar to other tests discussed, variants and extensions of the chi-square test (e.g., Fisher’s exact test, McNemar’s test) may be suitable depending on the variables.[8]
Example: Is there a relationship between individuals with methamphetamine in their system (yes vs. no; dichotomous) and gender (male or female; dichotomous)?
Correlation
Correlations (used interchangeably with ‘associations’) signal patterns in data between variables.[1] A positive association occurs if values in one variable increase as values in another also increase. A negative association occurs if variables in one decrease while others increase. A correlation coefficient, expressed as r, describes the strength of the relationship: a value of 0 means no relationship, and the relationship strengthens as r approaches 1 (positive relationship) or -1 (negative association).[5]
Example: Is there a relationship between age (continuous) and satisfaction with life survey scores (continuous)?
Linear Regression
Regression allows researchers to determine the degrees of relationships between a dependent variable and independent variables and results in an equation for prediction.[11] A large number of variables are usable in regression methods.
Example: Which admission to the hospital metrics (multiple continuous) best predict the total length of stay (minutes; continuous)?
Binary Logistic Regression
This type of regression, which aims to predict an outcome, is appropriate when the dependent variable or outcome of interest is binary or dichotomous (yes/no; cured/not cured).[12]
Example: Which panel results (multiple of continuous, ordinal, categorical, dichotomous) best predict whether or not an individual will have a positive blood culture (dichotomous/binary)?
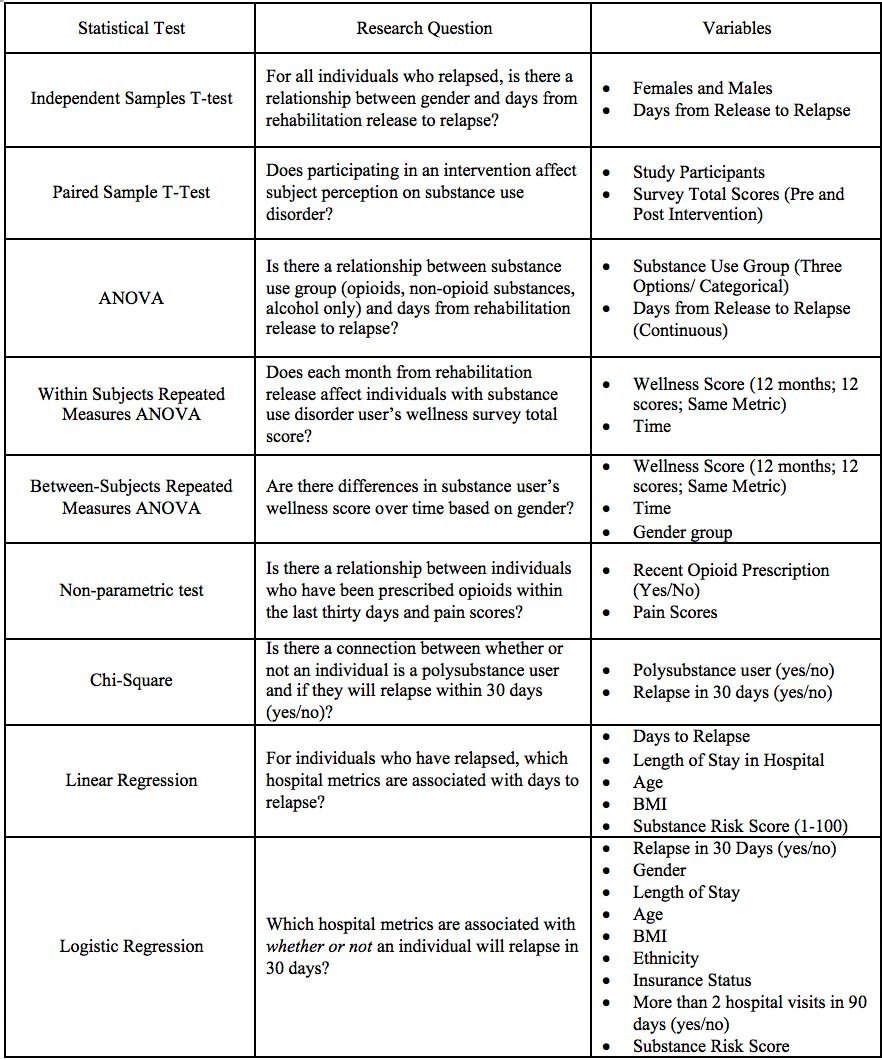
An example of one research focus, with each type of statistical design discussed, can be found in Table 1 to provide more examples of commonly used statistical designs.
(See Types of Variables and Statistical Designs Table 1)