Evaluation of Visual Acuity

Earn CME/CE in your profession:


Continuing Education Activity

Visual acuity is the clarity or sharpness of vision. Assessment of visual acuity is a crucial aspect of the ophthalmic examination and can have a significant clinical impact. Vision loss may be due to ocular disease, systemic disease, or diseases of other organ systems, including the central nervous system. Evaluation of visual acuity may be done in the prehospital, outpatient, or inpatient settings and should be included in the assessment of every patient with an eye-related complaint. Both distance and near visual acuity should be assessed; some circumstances may warrant an evaluation of visual acuity for intermediate distances. This activity reviews the importance of visual acuity testing as part of a routine physical examination, problem-based assessments, testing methods available, materials needed for visual acuity testing, and the clinical significance of visual acuity evaluation.

Objectives:

  • Differentiate the 4 types of visual acuity.

  • Choose the appropriate visual acuity testing modality and describe its technique.

  • Efficiently and effectively interpret and document the results of visual acuity testing.

  • Apply effective interprofessional team processes to improve patient outcomes by utilizing visual acuity testing in the prehospital, outpatient, and inpatient clinical settings.

Introduction

Visual acuity is a crucial aspect of the ophthalmic examination. A complete 8-point eye examination includes testing visual acuity, pupillary examination, evaluation of ocular motility and alignment, intraocular pressure (IOP), confrontation perimetry, external examination, slit-lamp examination, and examination of the ocular fundus. 

Defining visual acuity is as simple as stating it is the clarity or sharpness of vision.[1][2] Three terms frequently used when documenting the visual acuity portion of the ophthalmic examination are the Latin abbreviations OU, OS, and OD.[3] The full form of these are:

  • Oculus uterque (OU) - both eyes
  • Oculus sinister (OS) - left eye
  • Oculus dexter (OD) - right eye

The numbers from a visual acuity exam all hinge on what a “normal” person can see at a distance of 20 feet or 6 meters. If visual acuity is documented as 20/20 or 6/6, this number describes that the patient being examined can see the same as what a normal person sees or would usually see at a distance of 20 feet or 6 meters. If vision is documented as 20/40 or 6/12, a person with this visual acuity can see an image or object at 20 feet that a normal person could have recognized at a distance as far as 40 feet or at 6 meters versus 12 meters, respectively.

Visual acuity is a quantification of the sharpness of sight. It specifies a threshold. The acuity of vision is determined by the smallest appreciable retinal image. It is the measure of the tiniest object clearly visible at a certain distance. To appreciate the form of an object, its several parts must be recognized. The angle created at the nodal point of the eye by the smallest resolvable object is known as the minimum angle of resolution (MAR).

Four Types of Visual Acuity 

  • Minimum (detectable) visible acuity – This signifies the detection of an object or whether the object is present or not. This is quantified by the visual angle made at the nodal center of the eye by the tiniest detectable object.
  • Minimum (separable) resolvable acuity – This is indicated by the smallest separation between 2 parts of an object or 2 different objects resolvable as 2 different parts by the visual system. A person of normal sight, measured as 20/20 Snellen equivalent, can differentiate 2 objects that cast a visual angle of 1 minute (60 seconds or 0.017 degrees). Resolvable acuity is determined by the spacing of cones in the retina. However, some people can resolve a stimulus as small as 30 seconds of arc.[4]
  • Minimum recognizable acuity – This is denoted by the smallest feature that can be identified or recognized, like identifying a letter. Though 20/20 is considered the gold standard minimum recognizable acuity for humans, the mean visual acuity in age groups from 18 to 80 years may be better than 20/20. The sharpest mean visual acuity was noted in those aged 25 to 29 years.[5]
  • Minimum discriminable acuity – This is indicated by the smallest change in appreciable orientation, position, or size. It is also known as hyperacuity. The smallest misalignment we can realize is Vernier acuity, named after Pierre Vernier, who invented a scale used to navigate ships. Humans can proficiently detect whether adjacent lines are aligned (as in the Vernier scale), leading to the widespread use of this scale. The Vernier threshold for humans can be as low as 2 to 5 arc seconds.[6]

Anatomy and Physiology

Minimum detectable visual acuity measures the ability to differentiate between the intensity of the object and the background. In other words, it is a threshold of minimum detectable changes in contrast.

Minimum resolvable acuity and minimum recognizable acuity are limited by the spatial distance between the photoreceptors, aberrations, and pupil size (diffraction). When an object made of repeating black and white stripes is used to test visual acuity, there is a maximum spatial frequency beyond which the human visual system either sees a gray field or aliasing happens.[7] In aliasing, the orientation or width of stripes is misperceived. At the maximum spatial frequency, in the retinal image of the object, the center of the white stripe falls on one cone photoreceptor, whereas the center of the black stripe falls on another adjacent cone photoreceptor. Typically, one cycle of this maximal spatial frequency casts a visual angle of 1 minute or 60 seconds of arc.

Minimum discriminable visual acuity is called hyperacuity, as it is much finer than what can be explained by the spatial separation between the photoreceptors. This threshold is smaller than the foveal cone size (2.5 microns or 30 seconds of arc); the foveal cone size is considered a limiting factor for visual acuity.[6] Multiple hypotheses have been proposed on the mechanism of hyperacuity, including changes at the photoreceptor level or beyond and optical properties.[8][9] Cortical processing of the visual system is thought to play a crucial role in the Vernier acuity.[6]

Indications

Any patient with an eye complaint presenting to an emergency or outpatient department should have a documented eye examination.[10] All patients evaluated in the ophthalmology department are evaluated for visual acuity.

Contraindications

There are no contraindications to visual acuity testing. 

However, there are many clinical parameters that can complicate testing and negatively affect testing results. Some of these parameters include:

  • Ocular diseases
  • Illumination of the chart
  • Contrast
  • Pupil size
  • Type of optotype used
  • Refractive error
  • Retinal eccentricity
  • Duration of exposure
  • Crowding due to interaction from adjacent contours
  • Light exposure before the vision testing
  • Patient cooperation or functional disease

Equipment

Tests to Assess Visual Acuity

Tests to assess visual acuity fall into one of the three following groups.

Detection acuity tests assess the ability to detect the smallest stimulus. Examples of detection acuity tests include:

  • Boeck candy beads
  • Catford drum test
  • Dot visual acuity test
  • Schwarting metronome
  • STYCAR graded balls test

Recognition acuity tests assess the ability to recognize the stimulus. Examples of recognition acuity tests include:

  • Bailey-Hall cereal test
  • Bailey-Lovie chart
  • Beale Collin picture charts
  • Early treatment of diabetic retinopathy study (ETDRS) chart
  • Landolt C test
  • Lea symbols chart[11]
  • Lighthouse test
  • Lipmann HOTV test
  • Sheridan letter test
  • Sjogren hand test
  • Snellen charts
  • Snellen E test

Resolution acuity tests include:

  • Optokinetic drum
  • Preferential looking test

Vision Acuity Testing Options for Unique Age Brackets

Infancy

  • Cardiff acuity cards
  • Catford drum test
  • Fixation test
  • OKNOVIS
  • Preferential looking test- Teller acuity cards test
  • Reflex response
  • Visual evoked responses

Ages 1 to 2 years

  • Boeck candy test
  • Sheridan ball test
  • Worth ivory ball test

Ages 2 to 3 years

  • Coin test
  • Dot visual acuity test
  • Miniature toys test

Ages 3 to 5 years

  • Landolt C
  • Lea symbols chart 
  • Lippman HOTV test
  • Sheridan letter test
  • Tumbling E

Other Visual Testing

The Brückner test helps in detecting strabismus. A direct ophthalmoscope is used to obtain a red reflex simultaneously in both eyes. A patient with strabismus shows an increased light reflex in the deviated eye. This test also detects high anisometropia or refractive error.[12]

Relative Afferent Pupillary Defect (RAPD) testing using the swinging flashlight test detects asymmetric or unilateral optic nerve or retinal disease. A swinging flashlight test is done in a semi-dark room with the patient looking straight ahead. A bright light source is shone on one eye (A) for 3 seconds. Then, the light is rapidly shifted to the other eye (B). If the pupil of eye B dilates instead of constricting as it normally would, eye B is considered to have a relative afferent pupillary defect. Such a pupil is also called Marcus Gunn pupil.[13]

The cover test can detect the amblyopic eye in a preverbal child. Such children resist or cry when the better eye is covered or occluded. However, when the amblyopic eye is covered, there is minimal to no resistance.

Personnel

The personnel assessing visual acuity includes hospital staff, technicians, optometrists, ophthalmologists, advanced practice providers, and physicians.

Preparation

Providing a detailed explanation of the test to the patient ensures the best cooperation, as visual acuity is a subjective test. Specific tests can be used if malingering or functional vision loss is suspected.[14]

Technique or Treatment

To understand the applications of visual acuity testing, it is important to understand the different testing modalities used. The simplest method to evaluate distance visual acuity is a Snellen chart.[10][15] Care should be taken to have the patient stand at an appropriate distance from the chart in question and to test both eyes simultaneously as well as each eye individually. The visual acuity should be recorded as uncorrected (without glasses or contact lenses) and corrected (with glasses or contact lenses) visual acuity.

Methods of Assessing Visual Acuity 

The results of visual acuity tests are usually noted with V, VA, or Va. Distance visual acuity is recorded as UCVA (uncorrected visual acuity) or BCVA (best-corrected visual acuity). BCVA is the best visual acuity achieved with refraction. Near vision may be identified by NV. Usually, distance visual acuity is evaluated first. By convention, the visual acuity of the right eye is recorded, followed by the left eye, and then the binocular vision is recorded.

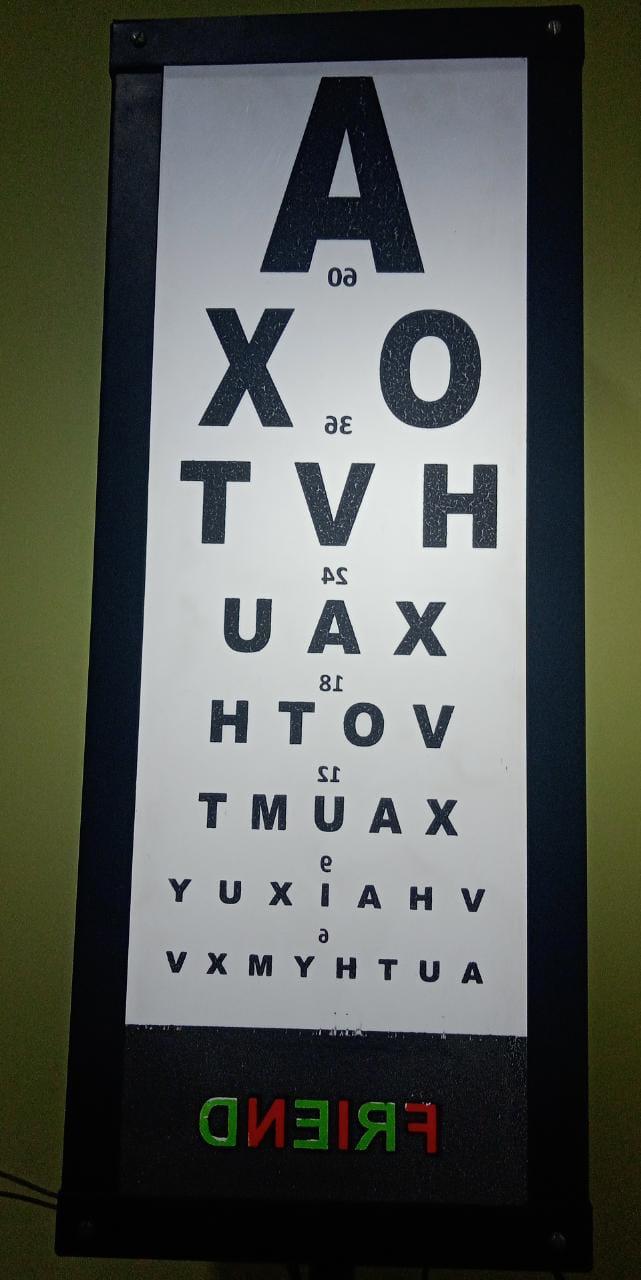
There are many visual acuity testing charts available. These charts can be printed, displayed on a computer or other screen, projected, or used with the help of a mirror. For testing at a distance of 6 meters in smaller examination rooms, a mirror can be placed at a 3-meter distance on the wall opposite the patient seat. The chart is placed on the wall behind the patient, just above their head. This chart is mirrored (horizontally inverted), and the letters become straight when viewed through the mirror (Figure 3). The image of the chart is formed behind the mirror at a distance of 6 meters from the patient.

Küchler Chart

The Küchler chartbelieved to be the oldest known eye chart, was invented by German ophthalmologist Heinrich Georg Küchler in the 1830s or 1840sThe original chart included images of birds, guns, farm equipment, frogs, and others. Küchler later published another chart with 12 rows of letters.

Snellen Chart

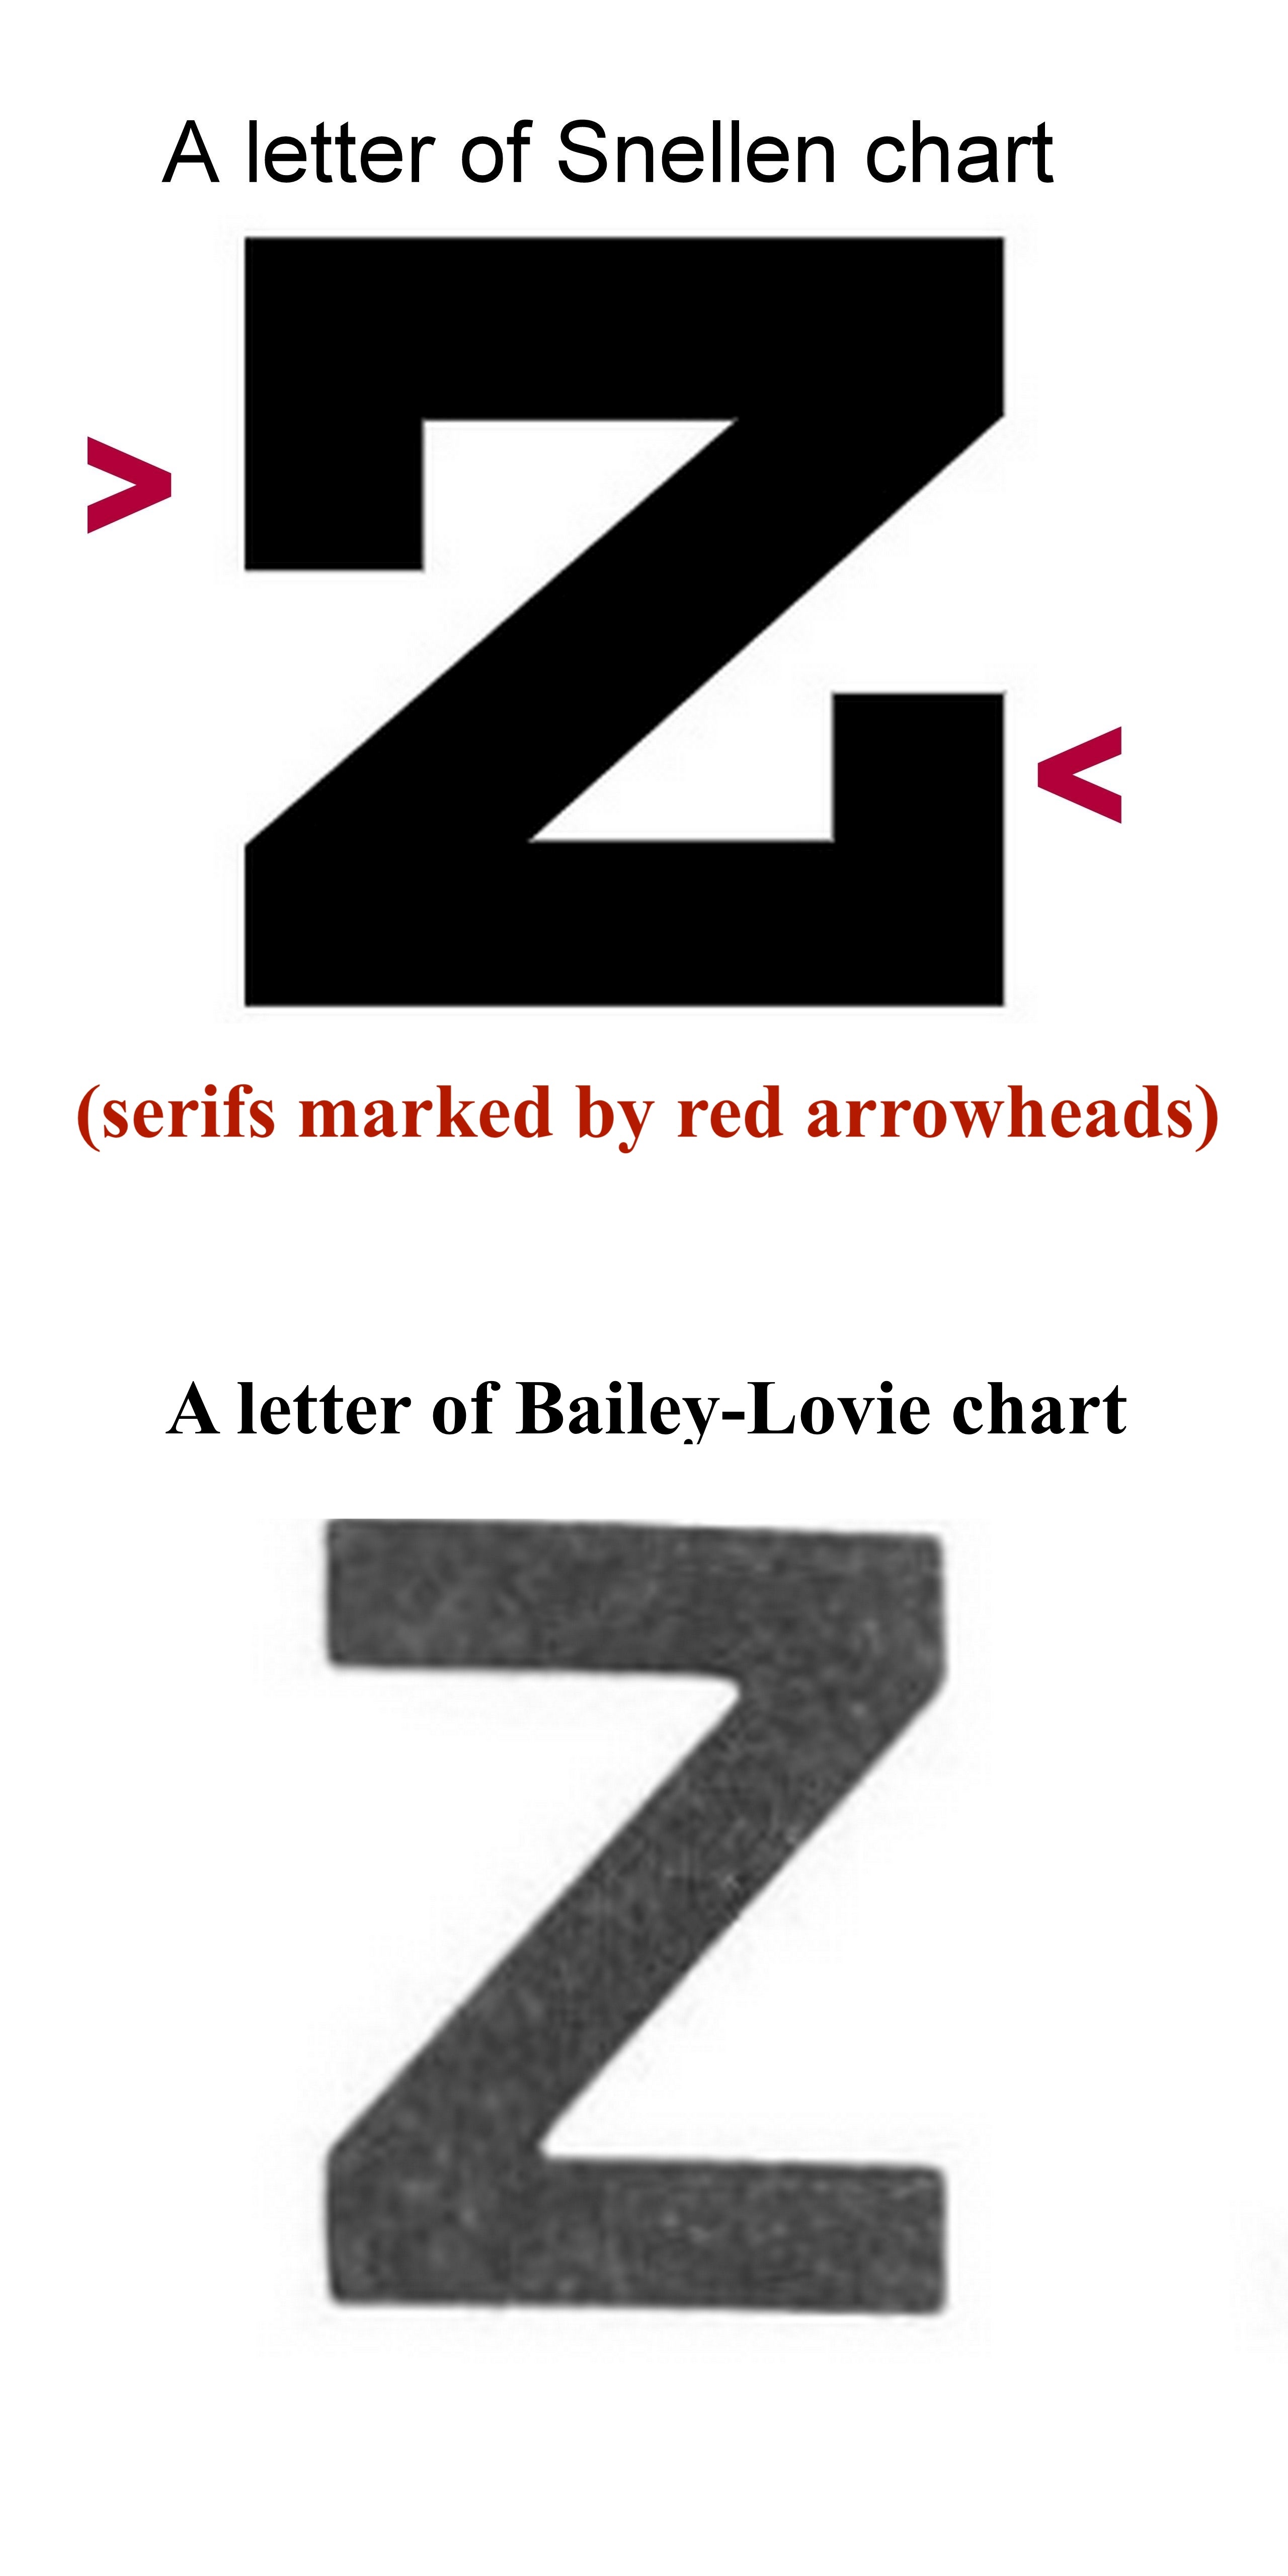
The Snellen chart was described in 1862 by Herman Snellen, a Dutch ophthalmologist.[15] This chart is very commonly used. The standard distance used for this chart is 20 feet or 6 meters. At this distance, the rays are almost parallel, and the patient usually does not accommodate to see at this distance. Chart luminance should be 80 to 320 cd/m2.[16] The usual luminance is 160 cd/m2. The Snellen chart has fewer letters in the upper part of the chart, and the number of letters increases as the visual acuity tested becomes finer toward the lower part of the chart. The spacing between horizontal letters varies between lines. The letters use serifs. Snellen called the targets used in the chart 'optotypes.'

The vertical height of a 6/6 (20/20) letter casts 5 minutes of arc at the nodal point of the eye when seen from 6 meters. The vertical height of each arm of E at 6/6 (20/20) line casts an angle of 1 minute of arc; in other words, the thickness of each stroke of the letter is 1 minute of arc. The height and width of the articles are the same (each is 5 times the stroke width). Thus, the height-to-width ratio is 5:5.

The height of a letter at the 6/6 (20/20) line is derived by the formula:

Tan (5min)= height of the letter in meters/6

Or, the height of the letter in meters = 6*tan 5 minute = 6*0.0015 meters = 0.009 meters = 9 mm

Similarly, the height of a letter in any line = 6 meters* tan (5x MAR)

The procedure to calculate MAR in minutes is described later.

In each of these charts, the black letters and white backgrounds have high contrast. The contrast is usually higher for a printed chart than for a projector-based chart. Therefore, the projector-based chart should be used in a dark room.

The size of a 6/36 letter is 60% of the 6/60 (20/200) letter. On the other hand, the size of a 6/6 (20/20) letter is 66% of a 6/9 (20/30) letter. Thus, the size change from one line to another is not uniform. Another issue with the Snellen chart is that finer visual acuity has more letters, which makes it difficult to read smaller letters due to the crowding phenomenon. This is especially true in patients with amblyopia. The letters used may not have similar legibility.[15] Reportedly, errors were more common with certain letters (S, F, C, B) than others (A, L, T, Z).[17]

There are 7 lines in the Snellen chart (Figure 1). However, variations of this exist (Figure 3). The usually denoted visual acuity in each line is as follows, from the uppermost to the lowermost line:

  • 6/60 (20/200) (contains one letter)
  • 6/36 (20/120) (two letters)
  • 6/24 (20/80) (three letters)
  • 6/18 (20/60) (four letters)
  • 6/12 (20/40) (five letters)
  • 6/9 (20/30) (six letters)
  • 6/6 (20/20) (seven letters)

As the lower rows have more letters, the chart has an A-shaped appearance from a distance.

The John Green chart from 1868 used sans-serif letters (Figure 2) and had up to 11 letters in each row. The spacing between letters was proportionate, and there was a geometric progression of the letter size in different rows.

The LogMAR Chart

To overcome the limitations of the Snellen chart, the logMAR chart was introduced by Bailey and Lovie in 1976.[18] Such charts may provide higher sensitivity and reliability in the measurement of visual acuity.

LogMAR is the abbreviation of log (base 10) of the MAR (expressed in minutes). For statistical analysis, logMAR visual acuity is the best option.[19]

The features of the Bailey-Lovie logMAR chart are:

  • The letters (optotypes) have equal recognition legibility and difficulty. This chart uses 10 sans-serif letters from the British Standard test charts for checking visual acuity as advocated by the British Standard Institution in 1968.
  • There are five letters on every line.
  • The height of a letter is 5 times the stroke width. The width of a letter is 4 times the stroke width. Thus, the ratio of height to width for each letter is 5:4.
  • The distance between each letter in a single line is equal to the width of the letters (uniform inter-letter spacing). This creates a similar contour interaction in each line and possibly casts a similar crowding effect in each line.
  • The distance between 2 rows is the height of the letters in the lower row (uniform inter-line or inter-row spacing).
  • The ratio of the size of each letter in one line to the adjacent line is constant (geometric progression or progression in logarithmic steps). Weber Fechner's law states that the perceived intensity of a stimulus is proportional to the logarithm of the intensity of the stimulus. Therefore, the fixed difference between adjacent lines is 0.1 Log unit (the lower line has less value than the upper line). This translates to a size change of around 1.25 times or the 10th root of 10 (upper line letters being larger). 
  • Each letter has a logMAR value of 0.02 in each line.
  • The Snellen notation [eg, 6/60 (20/200), 6/48 (20/160), etc) and logMAR values (1, 0.9, 0.8, etc) are given on either side of each row when seen from a 6-meter distance.
  • For nonstandard testing distance, the distance may be changed in a logarithmic scale at 0.1 log unit steps. The possible distances are taken in geometric progression (multiplication by 0.8) and include 6, 4.8, 3.8, 3 meters, and so on. Notably, these distances can be remembered by dividing the denominator of the Snellen notations of different rows (like 6/60, 6/48, 6/38, 6/30, and more) of this chart by 10. Depending on the distance used, a correction factor is added to the logMAR value noted in the chart. For 4.8 meters distance, the correction factor is 0.1; for 3.8 meters, it is 0.2; for 3 meters, it is 0.3, and so on. The correct logMAR value of VA at a distance is the sum of the logMAR value of the lowest row seen plus the correction factor for the distance. For example, if a person sees the row of 6/30 (logMAR 0.7) at 4.8 meters (correction factor 0.1), the corrected visual acuity in logMAR is 0.7+0.1=0.8. For a distance of 7.5 meters, the correction factor is -0.1 (minus point one). Nonstandard testing distances may be needed in
    • nonstandard design of the examination room
    • patients with low visual acuity
    • malingering
    • validation of visual acuity scores
  • The chart size is 80 cm (height) x 70 cm (width)
  • Chart appearance is V-like when seen from a distance

Disadvantages of the chart include more time required for the examination, and the chart itself is much larger.

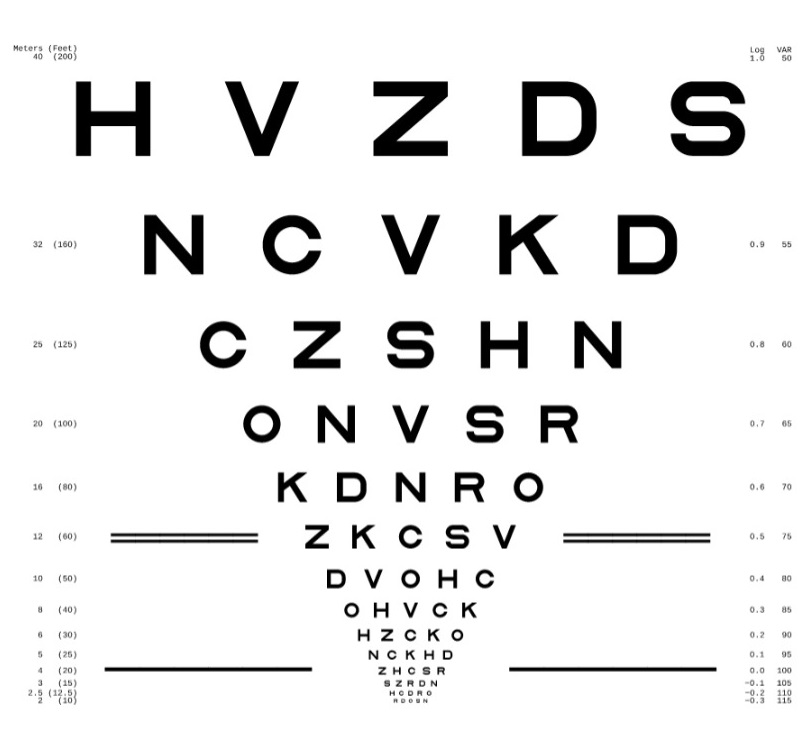
The most commonly used logMAR charts are the Bailey-Lovie and ETDRS charts (Figure 4).

ETDRS Chart

The ETDRS chart was described by Ferris and colleagues at the National Eye Institute, United States.[20] The ETDRS chart uses a luminance of 160 cd/m2.[16] Each optotype (Sloan letter, see below) has the same height and width; the ratio is 5:5. Thus, these letters are wider than the letters of the Bailey-Lovie chart. The ETDRS chart was designed to be read at a distance of 4 meters instead of 6 meters. The ETDRS chart may therefore be used to check visual acuity in smaller examination rooms.

The Snellen fraction at 4 meters may be converted to conventional American notation by multiplying the numerator and the denominator by 5. Thus, 4/5 is equivalent to 20/25. At 4 meters, the visual acuity is maximum, and the dispersion of visual acuity is minimum.[21] Refraction for infinity can be calculated by deducting 0.25 diopter from the refraction at 4 meters. Nonstandard distances used with the ETDRS chart are taken in a geometrical progression (3.2 m, 2.5 m, 2 m, 1.6 m, etc). The height and width of the chart are 60.3 cm and 63.5 cm, respectively. The reading of a single letter is allowed once only. 

Other Visual Acuity Testing Charts

Other tests to evaluate visual acuity include the Golovin–Sivtsev table, Freiburg Visual Acuity Test (FrACT, automated self-administered computerized test), and the Waterloo, Rosebaum, Monoyer, and Regan charts.[22]

The Waterloo chart has letters in a column. It may result in lower visual acuity due to the psychophysiological phenomenon that visual acuity is better when recognizing letters in rows than in columns.[23] In the Monoyer chart, the lowest line has the largest letters, and the name Monoyer is spelled out when reading the leftmost letters upwards. This chart is another of the oldest available vision charts.

Optotypes

The standardized letters and shapes used to test visual acuity are called optotypes. Various optotypes used for testing visual acuity include:

  • Landolt C chart - There are 4 configurations of the letter C, with the opening facing up, down, right, or left. Each configuration has similar legibility. Therefore, the chance of randomly guessing the correct response is 25% (1 in 4).
  • Illiterate E chart - There are 4 configurations of the letter E, with the opening facing up, down, right, or left. Therefore, the chance of randomly guessing the correct response is 25% (1 in 4).
  • Letters
    • When all letters are used, the chance of randomly guessing the correct letter is low (1/26 or around 4%).
    • The ETDRS chart uses Sloan letters, named after Louise Sloan, of which there are 10. Thus, the guess rate is 1/10, or 10%. The Sloan letters include C, D, H, K, N, O, R, S, V, and Z. The characteristics of the Sloan letter include equal difficulty in recognition of each letter when compared with the Landolt C chart.
    • The Bailey-Lovie chart used the British set of 10 letters, and the guess rate is 10%. These letters are D, E, F, H, N, P, R, U, V, and Z.
  • Numbers
  • Other optotypes, primarily used for children, include Allen pictures and symbols.

Procedure for Checking Visual Acuity

Visual acuity is denoted by the smallest recognized optotype. It is documented in at least one of the following notations: the British or American Snellen fraction (6/6 or 20/20, respectively), the decimal acuity, or the logMAR.

For the Snellen chart, the patient is 6 meters away from the chart. Standard room illumination is used except for projector-based vision charts, where a darkened or dim room is preferred. The usual contrast of the visual acuity charts is at least 80%. If the person reads only the top letter of the Snellen chart, visual acuity is documented as 6/60; the top letter, which should be read at 60 m, is being read at 6 m. The same visual acuity is written as 0.1 on the decimal scale and 20/200 per the American standard for the Snellen fraction. Visual acuity of 6/60 is equivalent to +1.00 on the logMAR scale.

Similarly, if the line that should be read at 36 m is being read at 6 m, this should be documented as 6/36, 0.16 on the decimal scale, or 20/120. Visual acuity of 6/36 is equivalent to +0.78 on the logMAR scale. This progression can continue to the seventh line, documented as 6/6, 1.0 on the decimal scale, +0.00 on the logMAR scale, or 20/20 as the Snellen equivalent.

The distance is gradually reduced if the patient cannot read 6/60 at 6 m. If the top letter is seen at a distance of 5 meters, this is documented as 5/60. If it is seen at 4 meters, it is documented as 4/60. If the top letter cannot be seen at 1 meter, the patient is asked to count fingers; the examiner holds a certain number of fingers close to the patient's face. Finger counting at 6 meters is usually considered equivalent to 6/60, as the size of the 6/60 letter is roughly similar to a finger. Similarly, finger counting at 5 meters is around 5/60, and so on. Finger counting can be utilized to check visual acuity at the bedside if a vision chart is unavailable. Hand movement or hand motion (HM) is tested in a patient who cannot count fingers close to the face.

For HM visual acuity, one eye is closed. A light is shone from behind the patient over a hand kept 60 cm in front of the eye. The patient is asked to indicate whether the hand is not moving, moving up-down, or moving right-left. If the patient gives a correct response, including the direction of movement, at least 4 of the 5 times they are tested, then HM visual acuity is documented as present.[24] 

The projection of rays (PR) is checked by closing the unaffected eye and asking the patient if they can correctly detect the direction from which the light from an indirect ophthalmoscope is projected over the eye (superior, inferior, nasal, or temporal). The responses of PR are recorded as + (present) or - (absent) in these quadrants. Light Perception (PL) is checked when the patient cannot appreciate hand movements. The light of an indirect ophthalmoscope set at maximum illumination is shone over the eye from the front at a distance of 90 cm. The patient is asked if the presence of light is appreciated or not.[24] Testing light perception with the potentially unaffected eye before checking the affected eye may help the patient cooperate and better comprehend the test. PL vision and no PL vision may not be quantifiable for statistical analysis.[19]

Testing Near and Intermediate Vision

The distance used for near vision testing may vary according to the work or occupation of the patient. Testing distances of 25, 30, 33, 35, or 40 cm are commonly used; 33 cm is most common. Charts for testing near vision include the Snellen, Times New Roman, or Jaeger near vision charts. In addition, charts for evaluating intermediate vision are available; testing usually is done at a distance of 66 cm or 80 cm.

Representation and Documentation of Visual Acuity

As aforementioned, many different nomenclatures are available to represent or document the results of visual acuity testing. British (test distance of 6 meters) and American (test distance of 20 feet) Snellen fractions are commonly used and described above.

The decimal fraction value is obtained by dividing the numerator of the Snellen fraction by the denominator. For example, for the Snellen fraction 6/60, 6 divided by 60 equals 0.1; this is the decimal fraction value.

The minimum angle of resolution (MAR) is the angle created at the nodal point of the eye documented in minutes. It is derived by dividing the denominator of the Snellen fraction by the numerator. Thus, for the Snellen fraction 6/60, 60 divided by 6 equals 10; this value, expressed in minutes, is the MAR.

The logMAR is the logarithm of MAR in minutes; the base is 10. For a Snellen fraction of 6/60, the MAR is 10, and the logMAR would be 1. For a Snellen fraction of 6/6, the MAR is 1, and the logMAR is 0.

Spatial frequency is expressed as cycles per degree (cpd). Spatial frequency is calculated by multiplying the decimal fraction value by 30. For example, for a Snellen fraction of 6/60, the decimal fraction is 0.1, equivalent to a spatial frequency of 3 cpd.

Louise Sloan introduced the M-unit (M) notation for the size of the optotype by converting the Snellen system to the metric system and using the formula decimal fraction value = test distance in meters (m)/letter size (M). According to the SI system, a patient with a visual acuity of 20/20 will be able to recognize a letter of 1M size at 1 meter. Similarly, a normal eye will be able to see a letter with a 20M size from 20 meters.

Complications

There are no complications of visual acuity testing.

Clinical Significance

Visual acuity testing can have a large clinical impact. Vision loss may be a feature of ocular diseases or a clue to the diagnosis of a systemic disease or disease of other systems, including the central nervous system.

Visual acuity should be used in conjunction with other ophthalmologic tests such as pupillary examination, intraocular pressure measurement, visual field testing, refraction, slit-lamp examination, and the examination of the retina. The best-corrected visual acuity in healthy eyes may show variation with age.[25] A study on 400 eyes of 200 individuals aged 25 to 74 years concluded that until 64 years of age, healthy eyes may be expected to have better than 20/20 (or LogMAR 0) vision.[25] This study noted that mean BCVA in healthy eyes remained constant (better than LogMAR -0.10 or 20/15) from 25 to 54 years of age, followed by an age-related breakpoint at 55 to 59 years of age, and after 60 years of age, the visual acuity declined (between LogMAR 0 or 20/20 and LogMAR -0.10 or 20/15).[25]

When evaluating visual acuity in preverbal children, techniques other than vision charts are used. These include:

  • Optokinetic nystagmus testing in infants involves passing a series of black and white stripes in front of the infant to elicit nystagmus. 
  • A preferential looking test can be used to evaluate visual acuity in infants. When an infant is presented with two visual stimuli, one striped and the other plain, the infant with normal visual acuity looks at the striped pattern for a greater amount of time. This is the basis of the Cardiff acuity test and Teller Acuity Cards II testing.
  • Visual evoked response/potential (VER/VEP) testing evaluates the EEG response recorded from the occipital lobe in response to visual stimuli. A sweep-VEP is performed by showing the preverbal child a pattern of grids or bars. When the stripes are prominent enough for the child to see (discriminate), a response is noted. For smaller stripes, no impulse is generated.[26][27]

Conversion of logMAR to Snellen equivalents is noted below.[19]

logMAR Snellen Equivalent
3  20/20000 [or hand movements at 2 feet]
 2 20 /2000 [or finger counting at 2 feet]
 1.60  20/800
 1.30 20/400 
 1.20   20/320
 1.18   20/300
 1.10   20/250
 1   20/200
 0.90   20/160
0.88   20/150
0.80   20/125
0.76   20/114
0.70   20/100
0.60   20/80
0.54   20/70
0.50 20/63
0.48   20/60
0.40   20/50
0.30   20/40
0.20  20/32
0.18   20/30
0.10   20/25
0.00   20/20
-0.10   20/16
-0.20  20/12.5
-0.30  20/10

 A detailed table of equivalent visual acuity measurements is given below:

20 ft

6 m

Decimal

4 m

MAR

(in minutes)

logMAR

20/630

6/190

0.032

4/125

31.5

+1.5

20/500

6/150

0.04

4/100

25

+1.4

20/400

6/120

0.05

4/80

20

+1.3

20/320

6/95

0.06

4/63

16

+1.2

20/250

6/75

0.08

4/50

12.5

+1.1

20/200

6/60

0.1

4/40

10

+1.0

20/160

6/48

0.125

4/32

8

+0.9

20/125

6/38

0.16

4/25

6.25

+0.8

20/100

6/30

0.2

4/20

5

+0.7

20/80

6/24

0.25

4/16

4

+0.6

20/63

6/19

0.32

4/12.5

3.15

+0.5

20/50

6/15

0.4

4/10

2.5

+0.4

20/40

6/12

0.5

4/8

2

+0.3

20/32

6/9.5

0.63

4/6.3

1.6

+0.2

20/25

6/7.5

0.8

4/5

1.25

+0.1

20/20

6/6

1.0

4/4

 1

0

20/16

6/4.8

1.25

4/3.2

 0.80

-0.1

20/12.5

6/3.8

1.6

4/2.5

 0.625

-0.2

20/10

6/3

2.0

4/2

 0.5

-0.3

Enhancing Healthcare Team Outcomes

Visual acuity is a crucial parameter to evaluate and monitor vision. Reduced visual acuity warrants meticulous physical examination and investigation. Interprofessional coordination by a team, including nursing staff, ophthalmologists, and optometrists, may improve patient care and, ultimately, the visual outcome.


(Click Image to Enlarge)
<p>A Snellen Eye Chart for Visual Acuity Testing

A Snellen Eye Chart for Visual Acuity Testing. This chart features varying letter sizes, with fewer at the top and increasing toward the bottom. The standard distance for testing is 20 feet or 6 meters, and a recommended luminance of 80 to 320 cd/m2.


Contributed by D Azzam


(Click Image to Enlarge)
<p>Serifs in Snellen Chart. The image shows the difference between the Snellen chart and the Bailey-Lovie chart.</p>

Serifs in Snellen Chart. The image shows the difference between the Snellen chart and the Bailey-Lovie chart.


Contributed by K Tripathy, MD


(Click Image to Enlarge)
<p>A Snellen Chart Used in a Small Clinic

A Snellen Chart Used in a Small Clinic. The letters are laterally reversed because a mirror is used to create an image at 6 meters from the patient. The patient looks at the mirror placed in front of them 3 meters away. The chart is placed behind and above the patient, attached to the wall.


Contributed by K Tripathy, MD


(Click Image to Enlarge)
<p>ETDRS Chart

ETDRS Chart. These charts are typically used for smaller examination rooms as they are designed to be read from 4 meters away.


Fvasconcellos, Public Domain, via Wikimedia Commons 

Details

Updated:

8/25/2023 3:04:39 AM

References


[1]

Becker R, Teichler G, Gräf M. Reproducibility of visual acuity assessment in normal and low visual acuity. Strabismus. 2007 Jan-Mar:15(1):3-6     [PubMed PMID: 17523039]


[2]

Kronbauer AL, Schor P, Carvalho LA. [Vision measurement and psychophysical tests]. Arquivos brasileiros de oftalmologia. 2008 Jan-Feb:71(1):122-7     [PubMed PMID: 18408854]


[3]

Miller JM, Ahmed H. OD, OS, and OU: Talking in Code? Journal of patient safety. 2019 Mar:15(1):e1-e2. doi: 10.1097/PTS.0000000000000556. Epub     [PubMed PMID: 30480649]


[4]

Kniestedt C, Stamper RL. Visual acuity and its measurement. Ophthalmology clinics of North America. 2003 Jun:16(2):155-70, v     [PubMed PMID: 12809155]


[5]

Elliott DB, Yang KC, Whitaker D. Visual acuity changes throughout adulthood in normal, healthy eyes: seeing beyond 6/6. Optometry and vision science : official publication of the American Academy of Optometry. 1995 Mar:72(3):186-91     [PubMed PMID: 7609941]


[6]

Hu ML, Ayton LN, Jolly JK. The Clinical Use of Vernier Acuity: Resolution of the Visual Cortex Is More Than Meets the Eye. Frontiers in neuroscience. 2021:15():714843. doi: 10.3389/fnins.2021.714843. Epub 2021 Oct 5     [PubMed PMID: 34675763]


[7]

Williams DR. Aliasing in human foveal vision. Vision research. 1985:25(2):195-205     [PubMed PMID: 4013088]


[8]

Westheimer G. Diffraction theory and visual hyperacuity. American journal of optometry and physiological optics. 1976 Jul:53(7):362-4     [PubMed PMID: 961819]


[9]

Westheimer G. Optical superresolution and visual hyperacuity. Progress in retinal and eye research. 2012 Sep:31(5):467-80. doi: 10.1016/j.preteyeres.2012.05.001. Epub 2012 May 23     [PubMed PMID: 22634484]


[10]

Patel H, Congdon N, Strauss G, Lansingh C. A need for standardization in visual acuity measurement. Arquivos brasileiros de oftalmologia. 2017 Sep-Oct:80(5):332-337. doi: 10.5935/0004-2749.20170082. Epub     [PubMed PMID: 29160549]


[11]

Vivekanand U, Gonsalves S, Bhat SS. Is LEA symbol better compared to Snellen chart for visual acuity assessment in preschool children? Romanian journal of ophthalmology. 2019 Jan-Mar:63(1):35-37     [PubMed PMID: 31198896]


[12]

Rajalakshmi AR, Rajeshwari M. Efficacy of Brückner's Test for Screening of Refractive Errors by Non-ophthalmologist Versus Ophthalmologist: A Comparative Study. Middle East African journal of ophthalmology. 2019 Oct-Dec:26(4):185-188. doi: 10.4103/meajo.MEAJO_121_19. Epub 2020 Jan 29     [PubMed PMID: 32153328]

Level 2 (mid-level) evidence

[13]

Simakurthy S, Tripathy K. Marcus Gunn Pupil. StatPearls. 2024 Jan:():     [PubMed PMID: 32491607]

Level 3 (low-level) evidence

[14]

Incesu AI. Tests for malingering in ophthalmology. International journal of ophthalmology. 2013:6(5):708-17. doi: 10.3980/j.issn.2222-3959.2013.05.30. Epub 2013 Oct 18     [PubMed PMID: 24195054]


[15]

Azzam D, Ronquillo Y. Snellen Chart. StatPearls. 2024 Jan:():     [PubMed PMID: 32644387]


[16]

Livingstone IA, Tarbert CM, Giardini ME, Bastawrous A, Middleton D, Hamilton R. Photometric Compliance of Tablet Screens and Retro-Illuminated Acuity Charts As Visual Acuity Measurement Devices. PloS one. 2016:11(3):e0150676. doi: 10.1371/journal.pone.0150676. Epub 2016 Mar 22     [PubMed PMID: 27002333]


[17]

Mathew JA, Shah SA, Simon JW. Varying difficulty of Snellen letters and common errors in amblyopic and fellow eyes. Archives of ophthalmology (Chicago, Ill. : 1960). 2011 Feb:129(2):184-7. doi: 10.1001/archophthalmol.2010.369. Epub     [PubMed PMID: 21320964]

Level 3 (low-level) evidence

[18]

Bailey IL, Lovie JE. New design principles for visual acuity letter charts. American journal of optometry and physiological optics. 1976 Nov:53(11):740-5     [PubMed PMID: 998716]


[19]

Holladay JT. Visual acuity measurements. Journal of cataract and refractive surgery. 2004 Feb:30(2):287-90     [PubMed PMID: 15030802]


[20]

Ferris FL 3rd, Kassoff A, Bresnick GH, Bailey I. New visual acuity charts for clinical research. American journal of ophthalmology. 1982 Jul:94(1):91-6     [PubMed PMID: 7091289]


[21]

Hofstetter HW. From 20-20 to 6-6 or 4-4? American journal of optometry and archives of American Academy of Optometry. 1973 Mar:50(3):212-21     [PubMed PMID: 4511814]

Level 3 (low-level) evidence

[22]

Bach M. The Freiburg Visual Acuity test--automatic measurement of visual acuity. Optometry and vision science : official publication of the American Academy of Optometry. 1996 Jan:73(1):49-53     [PubMed PMID: 8867682]


[23]

Freeman RD. Visual acuity is better for letters in rows than in columns. Nature. 1980 Jul 3:286(5768):62-4     [PubMed PMID: 7393322]

Level 3 (low-level) evidence

[24]

. Results of the Endophthalmitis Vitrectomy Study. A randomized trial of immediate vitrectomy and of intravenous antibiotics for the treatment of postoperative bacterial endophthalmitis. Endophthalmitis Vitrectomy Study Group. Archives of ophthalmology (Chicago, Ill. : 1960). 1995 Dec:113(12):1479-96     [PubMed PMID: 7487614]

Level 1 (high-level) evidence

[25]

Radner W, Benesch T. Age-related course of visual acuity obtained with ETDRS 2000 charts in persons with healthy eyes. Graefe's archive for clinical and experimental ophthalmology = Albrecht von Graefes Archiv fur klinische und experimentelle Ophthalmologie. 2019 Jun:257(6):1295-1301. doi: 10.1007/s00417-019-04320-3. Epub 2019 Apr 15     [PubMed PMID: 30989362]


[26]

Hamilton R, Bach M, Heinrich SP, Hoffmann MB, Odom JV, McCulloch DL, Thompson DA. VEP estimation of visual acuity: a systematic review. Documenta ophthalmologica. Advances in ophthalmology. 2021 Feb:142(1):25-74. doi: 10.1007/s10633-020-09770-3. Epub 2020 Jun 2     [PubMed PMID: 32488810]

Level 3 (low-level) evidence

[27]

Vedantham V, Ratnagiri PK. The Sweep-VEP: a faster estimation of visual acuity in preverbal children. Indian journal of ophthalmology. 2004 Jun:52(2):175; author reply 175     [PubMed PMID: 15283233]